We often need to check the correlation between the data in two or multiple columns. A couple of functions in Google Sheets can help us find the correlation between two columns by determining the correlation coefficient for the columns. We can also find the correlation by inserting a scatter plot. In this article, I’ll demonstrate these methods to find a correlation between two columns in Google Sheets. Also, I’ll discuss how you can determine the correlation between multiple columns.
A Sample of Practice Spreadsheet
You can copy our practice spreadsheets by clicking on the following link. The spreadsheet contains an overview of the datasheet and an outline of the demonstrated ways to find the correlation between two columns in Google Sheets.
What Is Correlation?
In statistics, correlation usually represents the extent to which a set of variables are linearly interconnected. We use correlations because they are helpful for indicating a predictive relationship that can be utilized in practice. The most common estimate of the correlation between two sets of data is Pearson’s correlation coefficient or simply the correlation coefficient. Now, there can be following 3 types of correlation between two sets of data.
Positive Correlation:
A positive correlation between two sets of data exists when the two variables move in the same direction as one another. A positive value of the correlation coefficient is found if a positive correlation exists between the two sets of data.
Negative Correlation:
A negative correlation exists between a set of data when an increase in one variable leads to a decrease in another. For a negative correlation, we get a negative value of the correlation coefficient.
No Correlation:
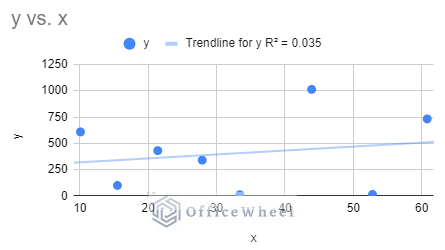
When any pattern can’t be detected between two variables, we can conclude there is no correlation between the two sets of data. The correlation coefficient value is very small for such data sets.
3 Ideal Ways to Find Correlation Between Two Columns in Google Sheets
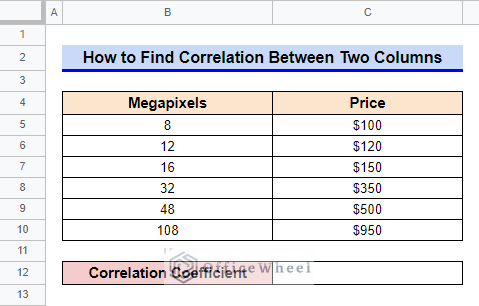
Firstly, let’s get familiar with our dataset. The dataset contains the average price of several mobile phones and the pixel size of the phones’ cameras. We want to find if there is any correlation present between the price of the phones and the pixel size of their cameras by evaluating the correlation coefficient.
1. Applying CORREL Function
The CORREL function can calculate the correlation coefficient between two columns. The CORREL function takes two ranges as arguments. We can enter the ranges as cell references or as direct numeric data sets in a pair of curly brackets ({}).
Steps:
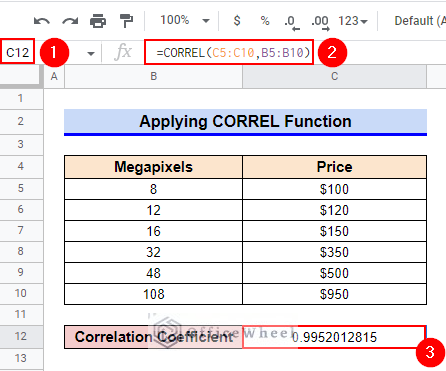
- Firstly, select Cell C12.
- Then, type in the following formula-
=CORREL(C5:C10,B5:B10)- Finally, press Enter key to get the required value of the correlation coefficient. The value of the correlation coefficient suggests a strong positive correlation between the two columns.
Read More: Find Difference Between Two Columns in Calculated Field of Google Sheets Pivot Table
2. Employing PEARSON Function
Another function that can enumerate the correlation coefficient is the PEARSON function. This function is almost identical to the CORREL function.
Steps:
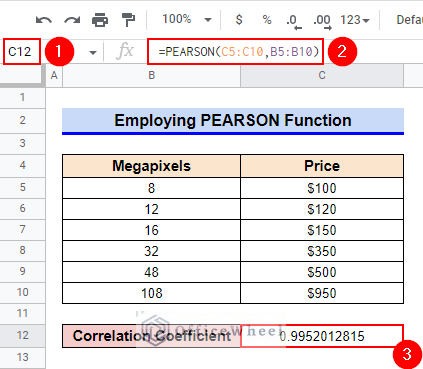
- First, select Cell C12.
- Afterward, type in the following formula-
=PEARSON(C5:C10,B5:B10)- Finally, press Enter key to get the required correlation coefficient. As you can see, the output is the same as the previous output.
Read More: How to Find Missing Values Between Two Columns in Google Sheets
Similar Readings
- How to Link Cells Between Tabs in Google Sheets (2 Examples)
- Calculate Number of Years Between Two Dates in Google Sheets
- How to Move Between Tabs in Google Sheets (3 Easy Ways)
- Google Sheets Count Cells Between Two Numbers with COUNTIF Function
- How to Use IF Condition Between Two Numbers in Google Sheets
3. Inserting a Scatter Chart and Extracting from Chart Label
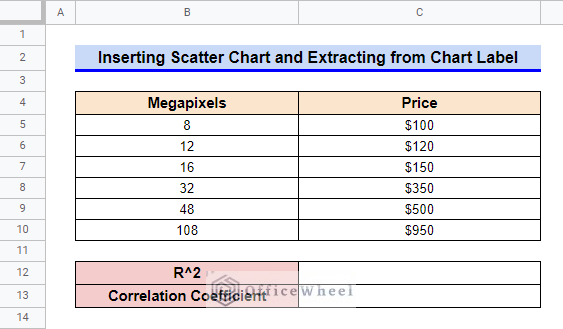
If you require visualization of the correlation in data then inserting a scatter plot and then extracting the value of the coefficient of determination (R2) to calculate the correlation coefficient (R) by using the SQRT function is preferable. To demonstrate this method, we have made a few modifications like the following to our dataset.
Steps:
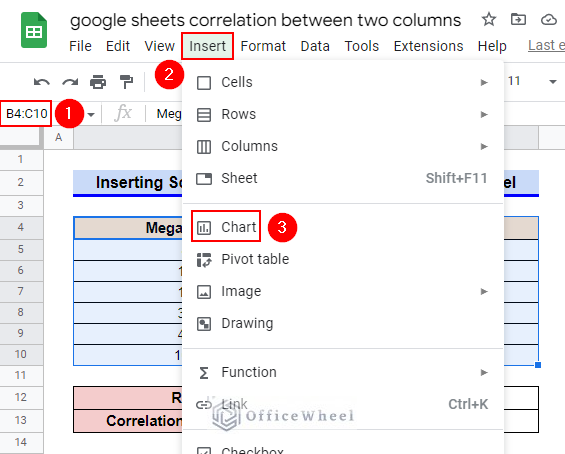
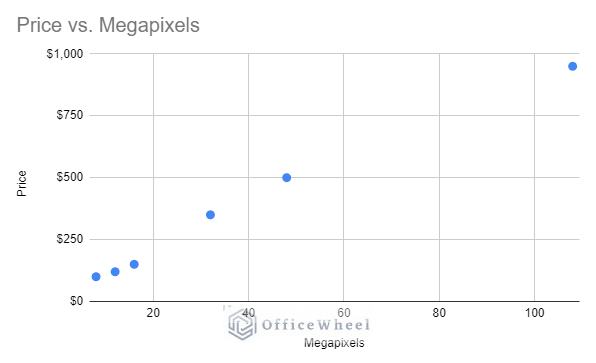
- First, select the range B4:C10 and then go to the Insert ribbon.
- Afterward, select the Chart command from the appeared options.
- A window with a line chart like the following will pop up along with a sidebar.
- Since, we require a scatter chart, in the sidebar, click on the drop-down icon of the Chart type option and then select Scatter chart from the options.
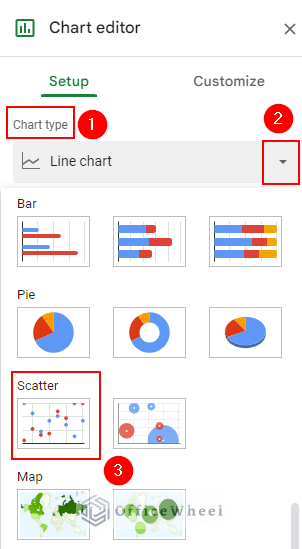
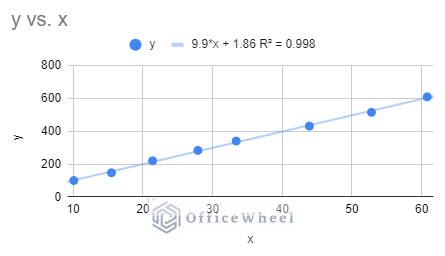
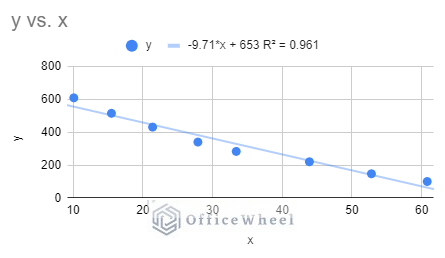
- This will change the line chart to a scatter chart. Now, we require the trendline equation to understand the type of correlation and then the R2 value to determine the correlation coefficient.
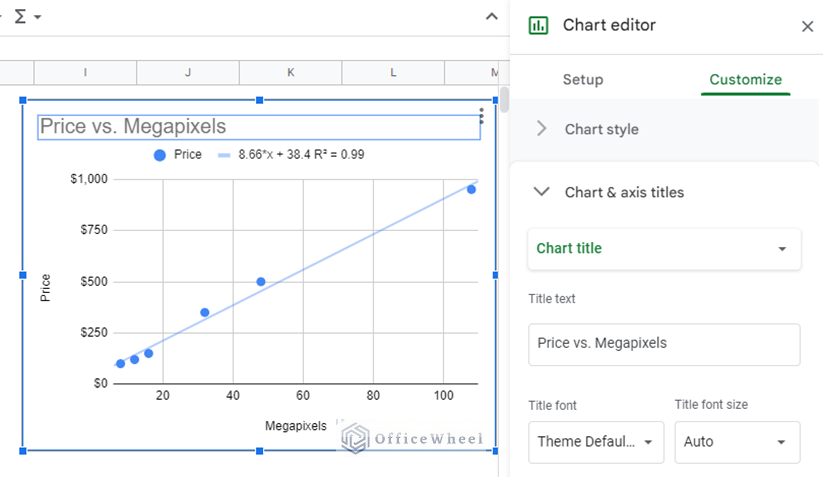
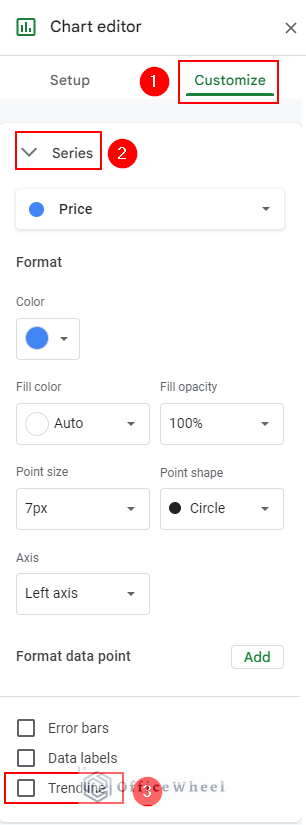
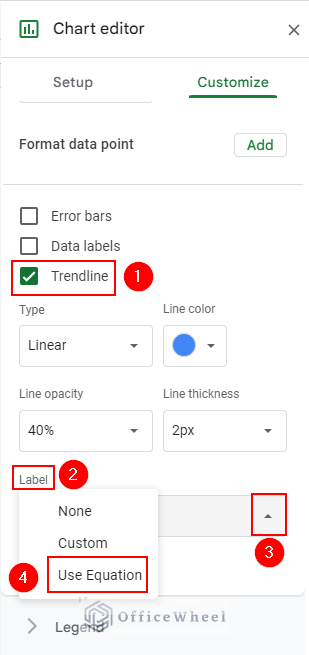
- For that, go to the Customize menu in the sidebar, and under the commands in the Series option, check the checkbox of Trendline.
- After the checkbox of Trendline is checked, new commands will appear. Click on the drop-down icon of the Label command and select the Use Equation option.
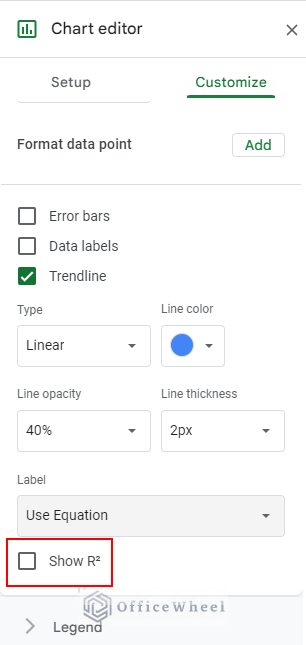
- Now, also check the checkbox of Show R2.
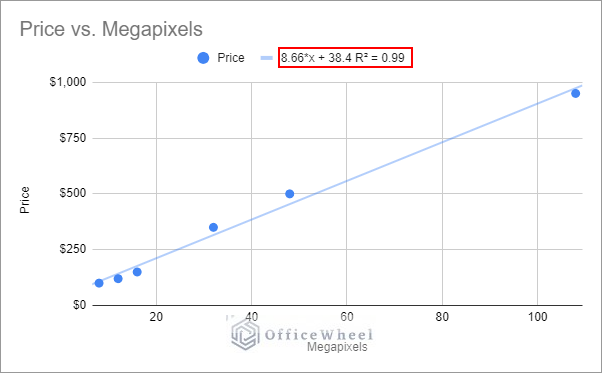
- This scatter chart now looks like the following. From the visualization of the trendline and its equation, we can clearly conclude a positive correlation.
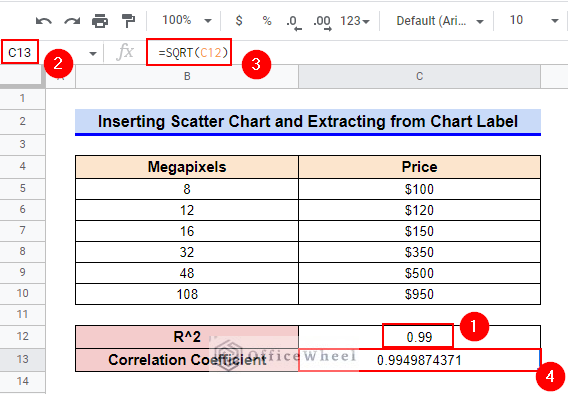
- Now, extract the value from the chart and paste it into Cell C12.
- Afterward, select Cell C13 and then type in the following formula-
=SQRT(C12)- Note that, if we had found a negative correlation, then we had to enter a negative sign before the SQRT function.
- Finally, press Enter key to get the required value of the correlation coefficient. This output is a little different than the previous two outputs. This is because the coefficient of determination has been rounded off.
Read More: How to Insert Lines Between Cells in Google Sheets
How to Find Correlation Between Multiple Columns in Google Sheets
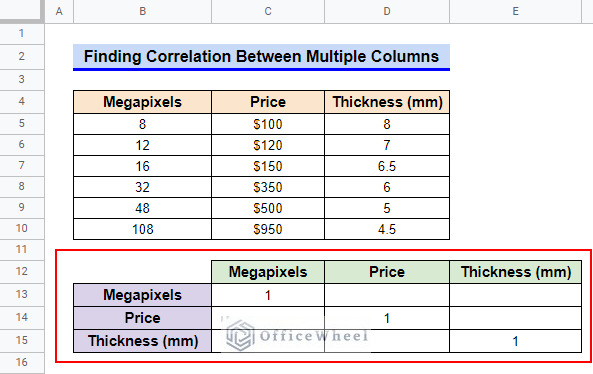
Now, to determine the correlation coefficient between multiple columns, we need to create a set for a combination of any of the two columns and then calculate the correlation coefficient for each of the combinations. We have added a new column that addresses the thickness of mobile phones. Also, we have created a correlation matrix using the Paste and Paste Special commands. The diagonal entries are 1 because the two argument ranges are identical for those cells. Now, we’ll use the CORREL function to determine the correlation between the price, camera pixel size, and thickness of any phone.
Steps:
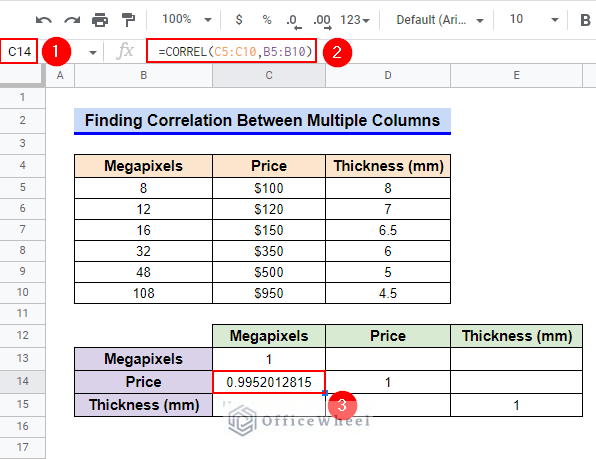
- First, select Cell C14 and then type in the following formula-
=CORREL(C5:C10,B5:B10)- Afterward, press Enter key to get the correlation coefficient for the correlation between price and camera pixel size.
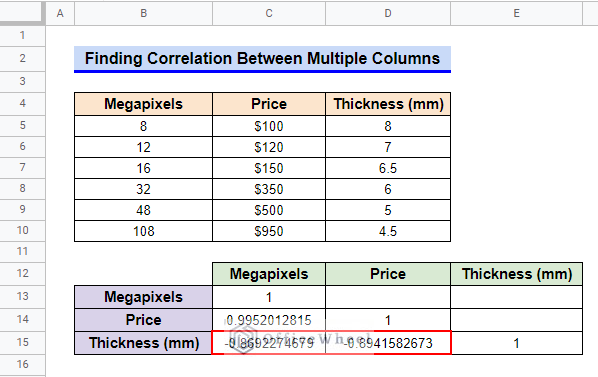
- Similarly, calculate the correlation coefficient for the correlations between camera pixel size and thickness and between price and thickness.
- As the correlation matrix suggests, there is a strong positive correlation between the price and camera pixel size of a phone and a strong negative correlation between other variables.
Read More: How to Find Unique Values Between 2 Columns in Google Sheets
Things to Be Considered
- The order of entry for x and y ranges in the CORREL and PEARSON functions is not a matter of significance.
- If we find a negative correlation, then we have to enter a negative sign before the SQRT function while determining the correlation coefficient from a scatter chart.
Conclusion
This concludes our article to learn how to find the correlation between two columns in Google Sheets. I hope the demonstrated ways were sufficient for your requirements. Feel free to leave your thoughts on the article in the comment box. Visit our website OfficeWheel.com for more helpful articles.
Related Articles
- Find Number of Months Between Two Dates in Google Sheets
- Conditional Formatting Between Two Values in Google Sheets
- How to SUMIF Between Two Dates in Google Sheets (3 Ways)
- Calculate Percentage Difference Between Two Numbers in Google Sheets
- Use REGEXEXTRACT Function Between Two Characters in Google Sheets
- Generate Random Numbers or Text Between Limits in Google Sheets
- Insert Rows Between Other Rows in Google Sheets (4 Easy Ways)