Suppose you are working on the projection of next year’s valuation of your company. You need to calculate this year’s data for this projection. But you cannot get accurate data with this calculation as this is a projection and you will get the realized value at the end of next year. In that case, you can add error bars in your google sheets. So, your projection dataset will show the error percentage. Here, we will learn how to insert error bars in google sheets.
Moreover, the overview of this article is shown above. You will learn more once you go through the total article.
A Sample of Practice Spreadsheet
You may copy the spreadsheet below and practice by yourself.
What Is Error Bar in Google Sheets
Sometimes we need to work on a dataset where we need to predict the data. So, keeping an uncertainty range or variability range is a smart move. If you make a chart from your dataset then add error bars in the chart to keep the variability of the data to keep the errors of the prediction. For instance, you are working on next season’s profit projection. So here you don’t know the actual value. But you can calculate the range based on this year’s profit. Once you convert your data into a bar chart you can insert error bar in the chart to add the uncertainty of the dataset.
Types of Error Bars in Google Sheets
There are 3 types of error bars in google sheets. You can insert error bars as per your requirement.
Percentage Error Bar: The percentage error bar is a process where you can insert the error percentage in the chart. Say, you want to keep the uncertainty of your value at 10%. Now you can insert 10% error bars and the percentage will be added to the value of that particular range.
Constant Error Bar: The constant error bar is like a percentage error bar but here you need to insert the exact uncertainty value. For example, you want to keep a window open for 5 million on your next year’s profit projection. So, you will insert 5 million error bars in your chart.
Standard Deviation Error Bar: This error bar is applied when you need to insert the standard deviation in the chart. Suppose you need to keep a window open exactly the same value as the standard deviation. Then you insert the standard deviation error bar in the chart.
3 Practical Examples to Insert Error Bars in Google Sheets
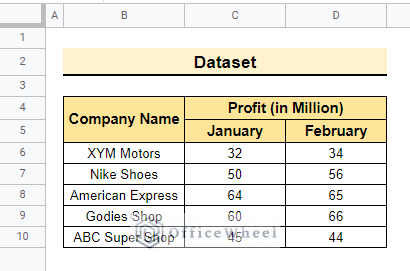
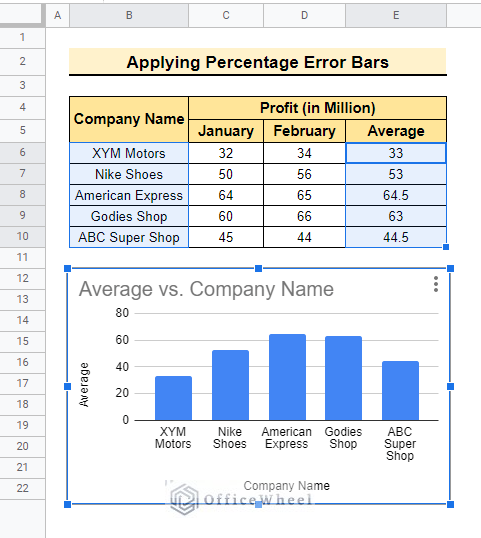
The dataset below contains Company Name, Profit (in Million), and the months we will calculate the profit January, and February. The dataset represents the companies’ profits from the month of January and February. We will add error bars of the profit margin using different processes. Suppose the profit margin is 6%. There we insert 6% error bars. Or if you convert this percentage into numbers then this 6% is 2 million in total profit. So we can also add 2 million in the chart as error bars. So, let’s start.
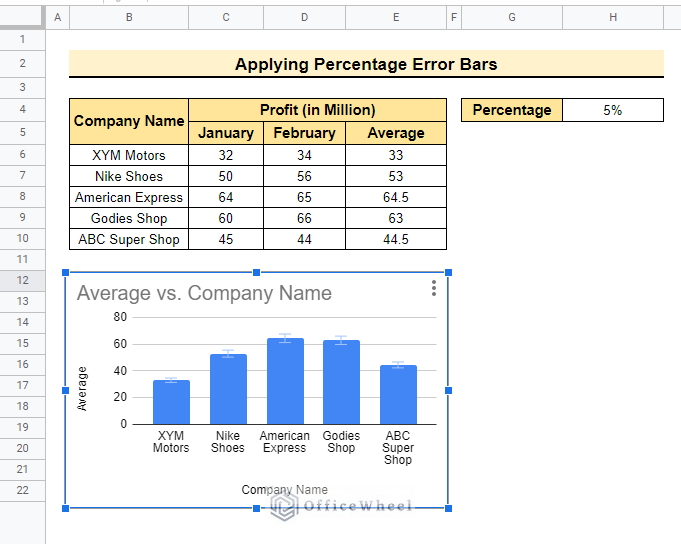
1. Applying Percentage Error Bars
Now we will apply percentage error bars in the chart. As said earlier, if we want to keep a window open on percentage form then use percent error bars. Follow the steps below to execute this process.
📌 Steps:
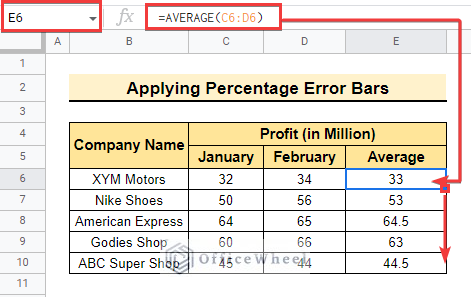
- This dataset represents the profit for the last two months. First, we calculate the average value of the last two month’s profit using the AVERAGE function and then make a chart with the average value.
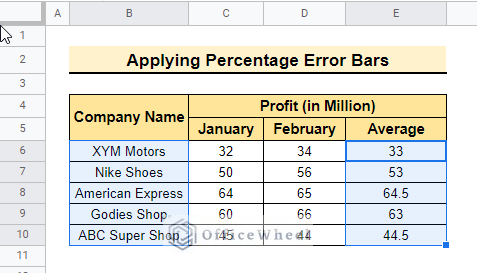
=AVERAGE(C6:D6)- Now, drag down the fill handle to copy the formula in the blank cells so that we get every average values to make a chart.
- Now, hold Ctrl key and select range B6:B10 and E6:E10 as X axis and Y axis.
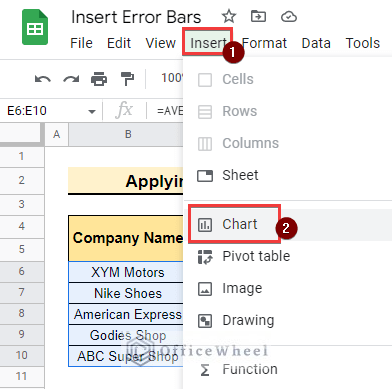
- Here, select Insert >> Chart to get a Bar Chart as below.
- Here is the new chart with the required information.
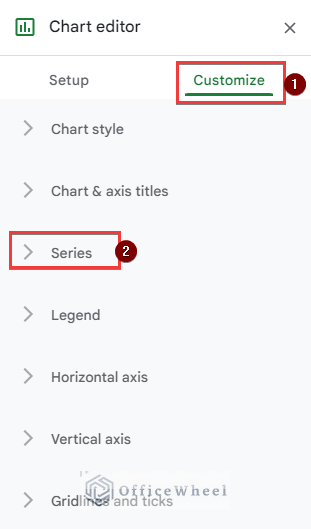
- Consequently, Chart editor window will appear with the bar chart and select Customize >> Series from the window.
- Once you select Series from Customize group, Error bars option will appear.
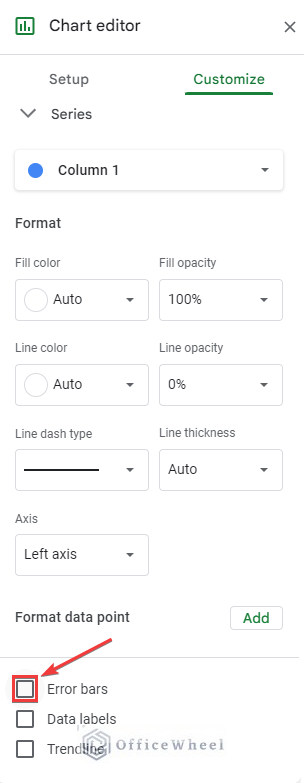
- After that, select the Error bars option and a drop-down list will appear.
- Select Percent from the drop-down list and add the required percentage of error in your dataset.
- Here, add a 5% error in the chart. So, the Bar chart shows 5% error bars in the chart.
- Lastly, here is the final output.
Read More: How to Insert Formula in Google Sheets for Entire Column
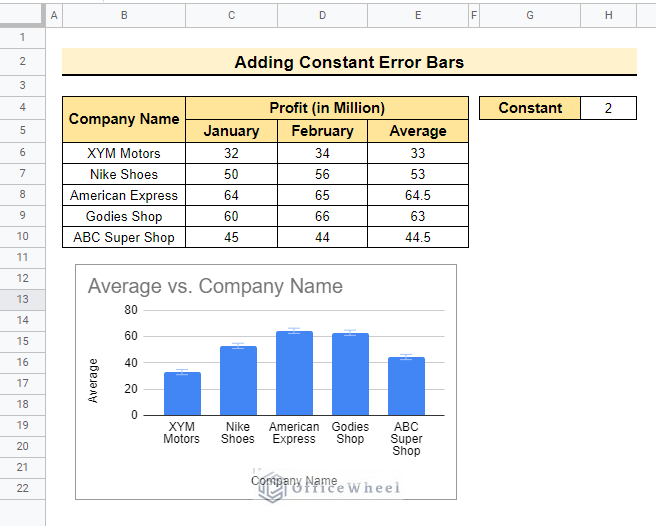
2. Adding Constant Error Bars
Here, inserting constant error bars will show you a number that is the open window of the errors. Follow the steps below to complete the process.
📌 Steps:
- Here, you can add constant error bars instead of a percent from the Error bars window.
- Initially, create a bar chart using the process already shown before.
- Therefore, select Constant from the drop-down list of the Error bars and write 2 as we will keep 2 million errors in the error bar.
- In the end, the final output is below.
Read More: How to Insert a Legend in Google Sheets (With Easy Steps)
Similar Readings
- How to Insert Video in Google Sheets (2 Easy Ways)
- Insert Serial Numbers in Google Sheets (7 Easy Ways)
- How to Insert Multiple Columns in Google Sheets (2 Quick Ways)
- Insert a Textbox in Google Sheets (An Easy Guide)
- How to Insert Multiple Rows in Google Sheets (4 Ways)
3. Using Standard Deviation Error Bars
Another way is inserting the standard deviation error bars. Let’s complete the process following the steps below.
📌 Steps:
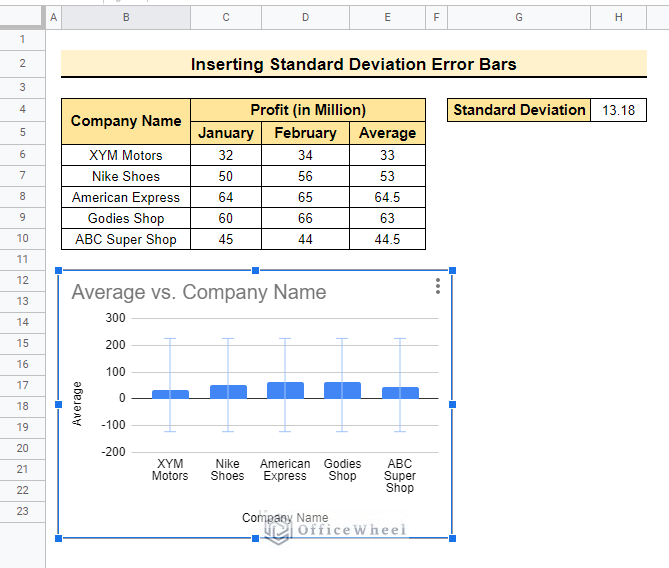
- In the beginning, create the bar chart with the steps already shown before.
- After that, select cell H4 and calculate the total standard deviation of the average value using the STDEV function of the dataset.
=STDEV(E6:E10)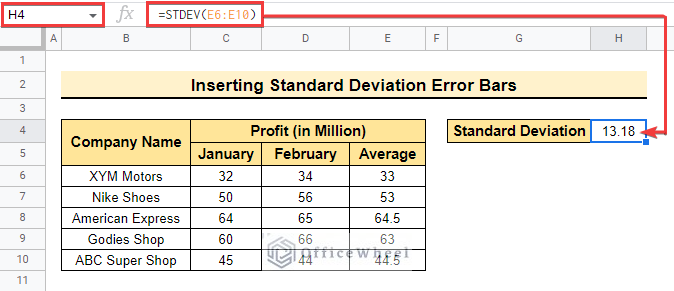
- Now, following the previous methods, select Standard Deviation From the drop-down bar of Error bars.
- Last, here is the final output below.
Read More: How to Insert a Drop-Down List in Google Sheets (2 Easy Ways)
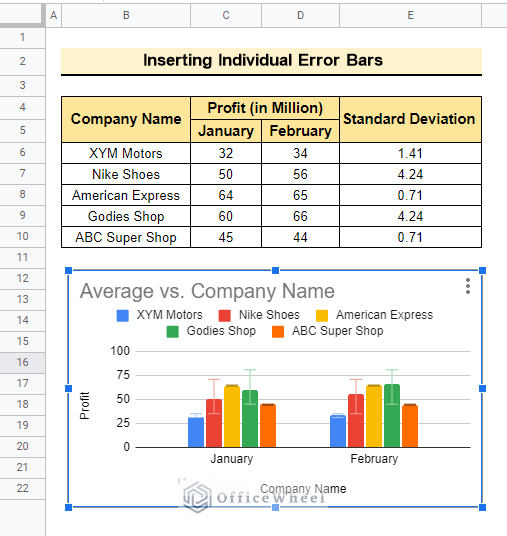
How to Insert Individual Error Bars in Google Sheets
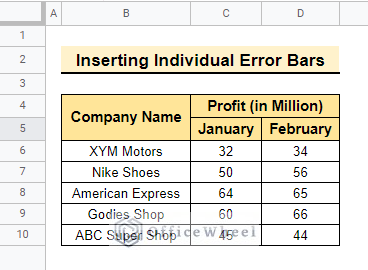
We can also insert customized error bars selecting multiple datasets at a time. Suppose, you need data projection for 3 months in a row but working on 3 different charts can take a lot of work. Now you can get 3 different error percentages in a single chart using the below process. Now follow the steps below to insert the error bars for multiple datasets using the below dataset.
📌 Steps:
- In the beginning, create a bar chart following the steps earlier.
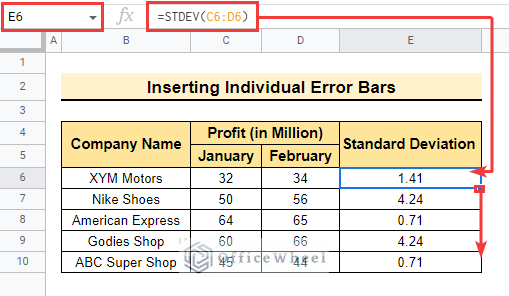
- Afterward, calculate the standard deviation of these two months as below.
=STDEV(C6:D6)- Then, drag down the fill handle to copy this formula in the blank cells so that we get standard deviation for individual companies.
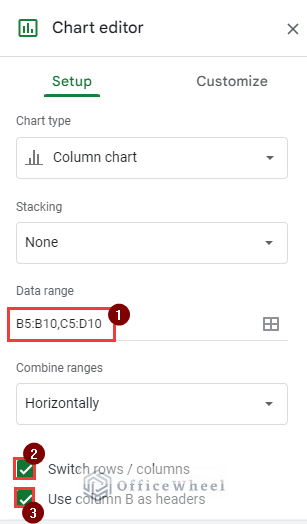
- Moreover, select the range B5:B10, and C5:D10 in the Data range option to get the standard deviation of the profit in January, and February of these two months.
- Then, select Switch rows/columns and Use column B as headers so that the company name is in the X axis.
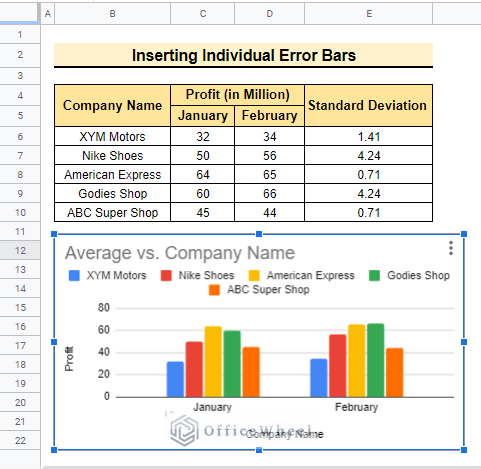
- The output is below.
- Therefore, select Customize >> Series and select the company name from the drop-down menu. Here, first, select XYM Motors from the drop-down list and add error bars.
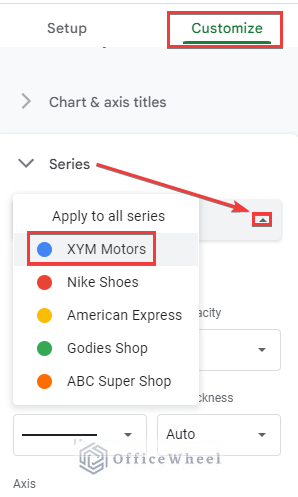
- Then, select Standard Deviation from Type group and write down 1.41 as the specific standard deviation of this company is 1.41.
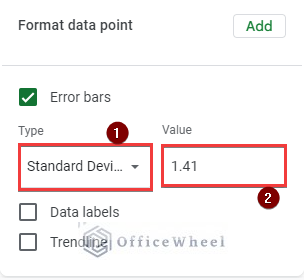
- Lastly, enter the information of the other companies using the similar way already shown in XYM Motors. For instance, if you want to insert the standard deviation of Nike shoes then select Nike Shoes from Series and insert the standard deviation of this company in the Error bars.
- Repeat the procedures for all other companies.
- In the end, the final output is below.

Things to Remember
- Select the dataset carefully. If your dataset has merged columns then the chart won’t show you the proper axis name. In that case, double-click on the name and manually add the actual name.
- We can add more than one dataset under one individual error bar.
Conclusion
In this article, we explained how to insert error bars in google sheets using different options. Hopefully, these processes will help you apply this method to your dataset. Please let us know in the comment section if you have further queries or suggestions. You may also visit our OfficeWheel blog to explore more Google Sheets-related articles.
Related Articles
- How to Insert Superscript in Google Sheets (2 Simple Ways)
- Insert Button in Google Sheets (5 Quick Steps)
- How to Add Parentheses in Google Sheets (5 Ideal Scenarios)
- Insert Blank Column Using QUERY in Google Sheets
- How to Insert Yes or No Box in Google Sheets (2 Easy Ways)
- Insert Sparklines in Google Sheets (4 Useful Examples)
- How to Insert Equation in Google Sheets (4 Tricky Ways)