The 50 day moving average is a useful tool for identifying trends in data. It is calculated by taking the average of a security’s price over the past 50 days. In Google Sheets, the AVERAGE function can be used to quickly and easily calculate the 50 day moving average. This indicator is particularly helpful for analyzing stock prices and other types of data.
A Sample of Practice Spreadsheet
You can copy our spreadsheet that we’ve used to prepare this article.
What Is Simple Moving Average in Google Sheets?
Simple Moving Average (SMA) is a technical analysis tool that calculates the average price of a security over a specific period by continuously adding up the closing price of the security and dividing the total by the number of periods. In Google Sheets, SMA can be calculated using the AVERAGE function over a range of cells.
Short Introduction to GOOGLEFINANCE Function in Google Sheets
The GOOGLEFINANCE function in Google Sheets allows users to retrieve current or historical financial information from a variety of markets and exchanges. This function can be used to track stock prices, currency exchange rates, and other financial metrics.
Syntax:
=GOOGLEFINANCE(ticker, [attribute], [start_date], [end_date|num_days], [interval])Here is an example of the GOOGLEFINANCE function to retrieve the stock price for Apple Inc. on a given date, the formula would be:
=GOOGLEFINANCE("AAPL","price","3/1/2022","6/1/2022")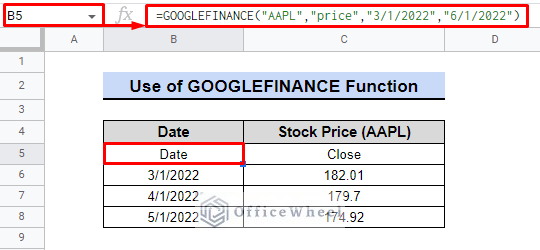
In the “Stock Price (AAPL)” column, the GOOGLEFINANCE function would return the closing price of the stock for each respective date in the table.
2 Simple Methods to Find 50 Day Moving Average in Google Sheets
Google Sheets offers two easy ways to calculate the 50 day moving average, a commonly used indicator in stock market analysis. Both methods offer a quick and efficient way to find this important trend line in your data.
1. Using GOOGLEFINANCE with AVERAGE Function
Assume that we are going to find the 50 day moving average of TESLA Inc. (TSLA) stock.
Step:
- Firstly, we are going to find the stock rate of the last 50 days using the following formula in cell B5.
=GOOGLEFINANCE("TSLA","close",TODAY()-50,TODAY())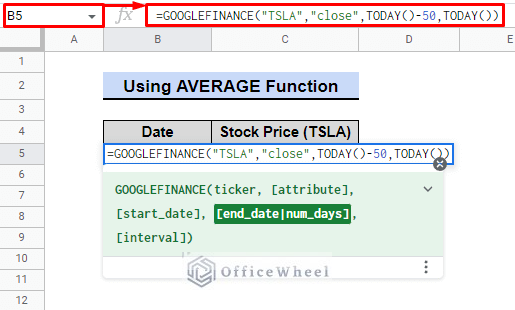
Formula Breakdown:
- The “TSLA” in the formula is the stock’s ticker symbol for Tesla.
- “close” specifies that we want the closing stock price.
- The date range for retrieving stock prices is set to the past 50 days up to today using “TODAY()-50” and “TODAY()”.
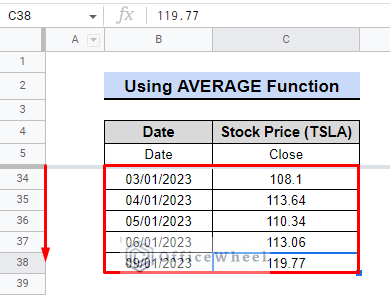
- Use the fill handle to find the closing values for the last 50 days.
- However, in this case, the dataset is limited to the last 33 days, as only trading days are considered in the calculation of the previous 50 days
- Now, we are simply going to use the AVERAGE function in cell C40 to get the average of the stock price for the last 50 days using the following formula.
=AVERAGE(C5:C38)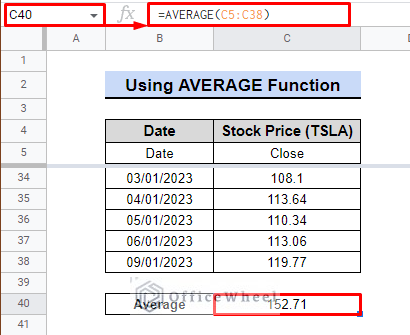
In summary, we have determined that the average stock price of TESLA over the past 50 trading days is 152.71.
Read More: How to Use AVERAGE Function in Google Sheets (4 Examples)
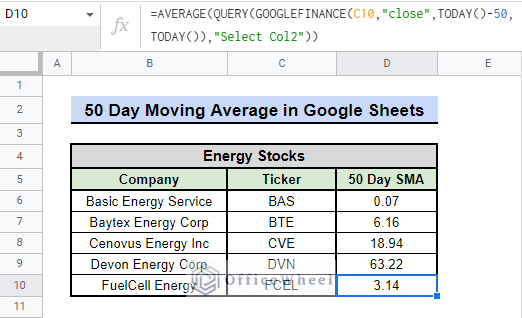
2. Applying GOOGLEFINANCE with QUERY Function
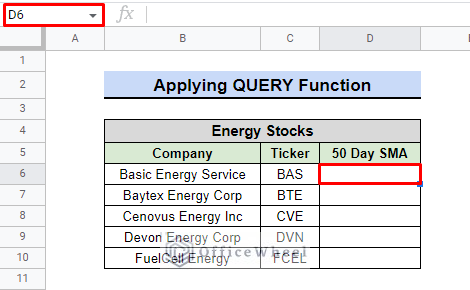
Considering that we have a dataset of 5 energy companies, we need to find the average price of these energy stocks for the last 50 days.
This time, we will use the QUERY function to calculate the SMA of the last 50 days for each company along with GOOGLEFINANCE.
Steps:
- We are going to choose cell D6 first.
- Now we will use the following formula to retrieve the average price of the Basic Energy Service stock.
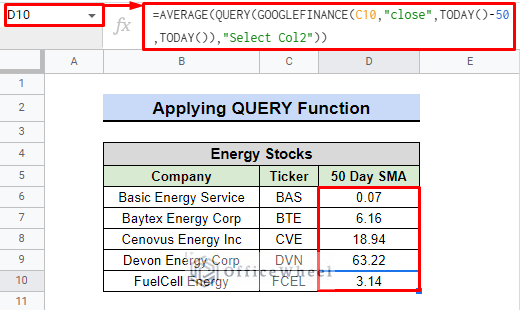
=AVERAGE(QUERY(GOOGLEFINANCE(C6,"close",TODAY()-50,TODAY()),"Select Col2"))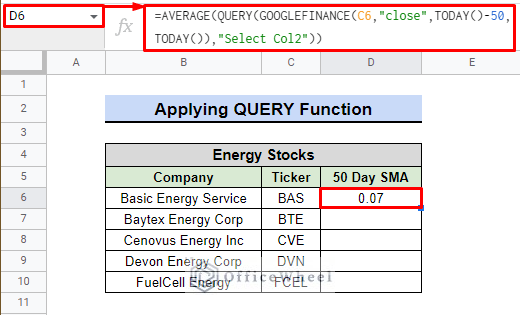
- GOOGLEFINANCE(C6,”close”,TODAY()-50,TODAY()): The formula retrieves the closing prices for a specific stock for the past 50 days until today by using the GOOGLEFINANCE function. The TODAY() function returns the current date. The start date range is specified using the TODAY()-50, which is 50 days in the past.
- QUERY(…,”Select Col2″): QUERY function selects and filters a specific column “Col2” from the GOOGLEFINANCE results.
- AVERAGE(QUERY(…)): The AVERAGE function takes the QUERY result and calculates the average of all values in the column.
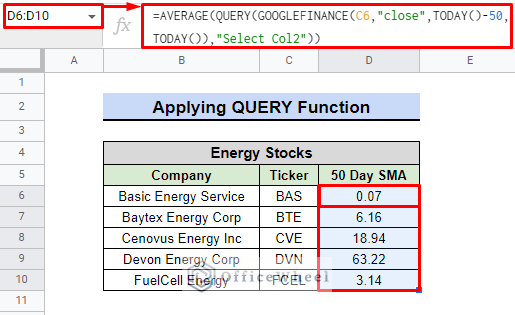
Finally, we can see that the formula has derived the average price of the stocks for the last 50 days.
Read More: How to Find 7-Day Moving Average in Google Sheets
Similar Readings
- How to Insert Moving Average Trendline in Google Sheets
- Calculate Moving Average in Google Sheets (2 Ways)
- How to Find Exponential Moving Average in Google Sheets
- Calculate Weighted Moving Average in Google Sheets
Can You Calculate 200 Days of Simple Moving Average?
Yes, we can.
Think about the situation where we need to determine the 200-day SMA for BlackBerry stocks. To reach the outcome, we can take some easy steps.
Steps:
- First, we need to select the cell, C6.
- Afterward, we are going to use the following formula:
=AVERAGE(QUERY(GOOGLEFINANCE("BB","close",TODAY()-200,TODAY()),"Select Col2"))- Note that the only real change we have brought from the previous formula is that we changed 50 to 200.
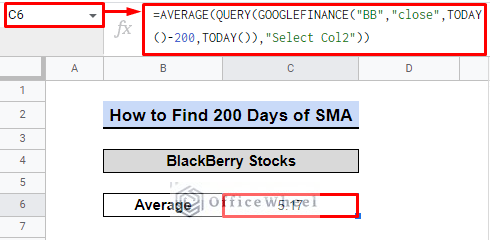
Finally, we can see that it has retrieved the average price of the BlackBerry stock, which is 5.17 over the last 200 days.
Read More: How to Find 200-Day Moving Average in Google Sheets (2 Ways)
Conclusion
In conclusion, utilizing the 50 day moving average in Google Sheets is a valuable tool for professionals to analyze and track market trends. It serves as a reliable indicator for making informed decisions. The QUERY formula is undoubtedly the best approach. This powerful function can significantly aid in the monitoring of investments and overall financial performance. For additional assistance, visit OfficeWheel.