In order to see the current trend of any business parameter, moving average trendlines are crucial. It identifies the current trend direction and smoothies out the outlier. It’s very simple to add moving average trendlines in Google Sheets. In this article, we’ll walk through step-by-step procedures to insert the moving average trendline of the closing price of stocks in Google Sheets.
A Sample of Practice Spreadsheet
You can download the spreadsheets from the link below. The spreadsheets contain a dataset we use here. After downloading you can practice on your own as we demonstrate here.
What Is Simple Moving Average (SMA)
A simple moving average is an arithmetic average calculated by adding certain periods of recent data and then dividing the summation by the number of periods. For example, if we want to calculate three days moving average of the closing price of stocks then we have to divide the summation of the closing price of last three days by three.
Step by Step Procedures to Insert Moving Average Trendline in Google Sheets
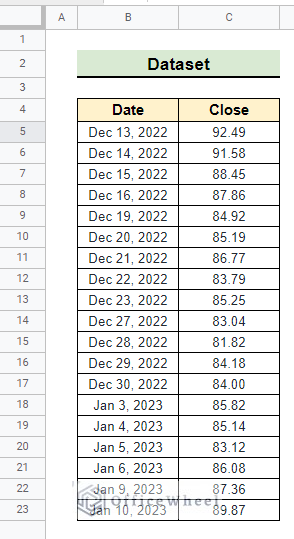
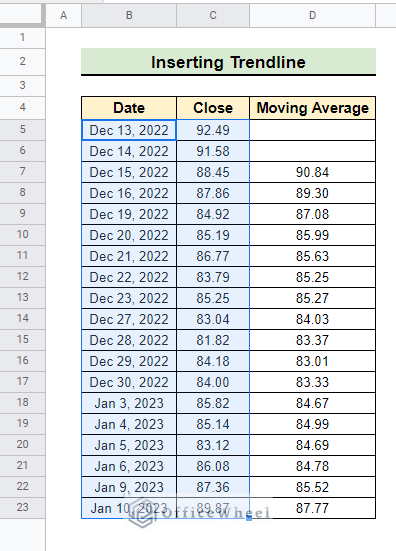
The following dataset contains one month’s closing price of AMAZON stocks. Now, we want to calculate and insert a moving average trendline using this data.
Step 1: Importing Data from Google Finance
We can easily download a dataset from Google Finance and fit trendline in that dataset.
- Let us import the dataset from Google Finance. For that, we select cell B4 and insert the formula in the formula bar.
=GOOGLEFINANCE("NASDAQ:AMZN","close",TODAY()-30,TODAY())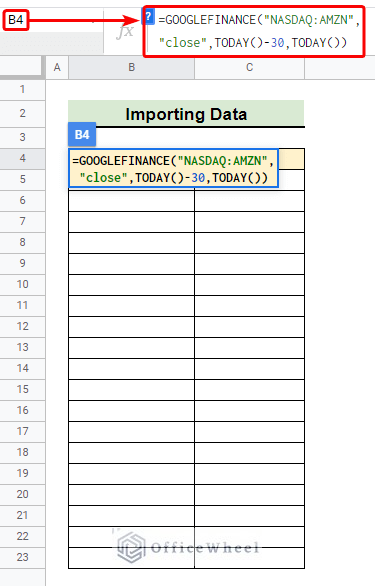
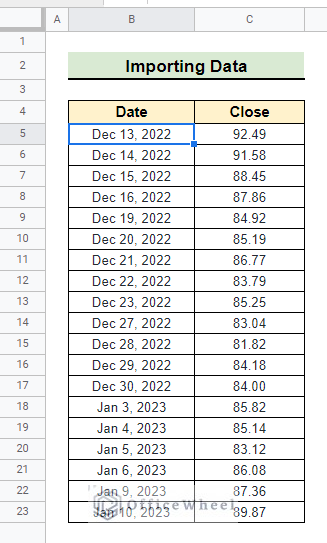
- Then we press Enter. As a result, the closing price of AMAZON’s stocks over the past month loaded as follows.
Step 2: Calculating Moving Average
We can calculate the moving average in various ways. First, we want to see how the AVERAGE function can be used for calculating the moving average.
I. Using AVERAGE Function
Calculating the moving average using the AVERAGE function is very simple. Here we demonstrate how to calculate three day-moving average using the AVERAGE function.
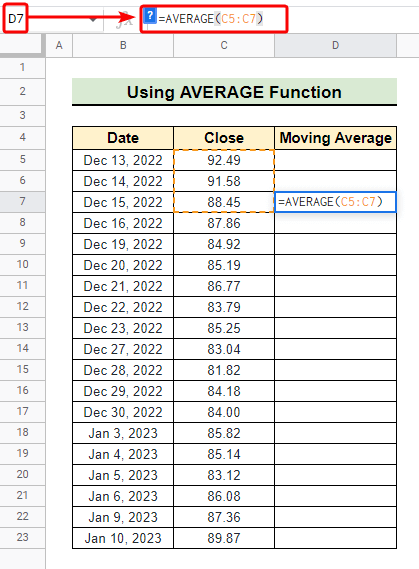
- First of all, we select cell D7 and write down the formula below in the formula bar.
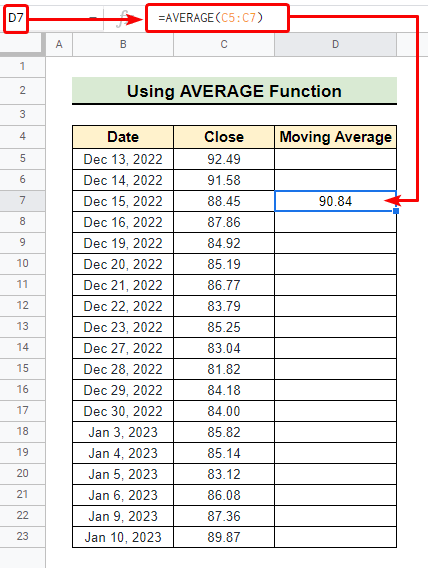
=AVERAGE(C5:C7)- Subsequently, hit Enter.
- Consequently, we get the three days moving average in the selected cell.
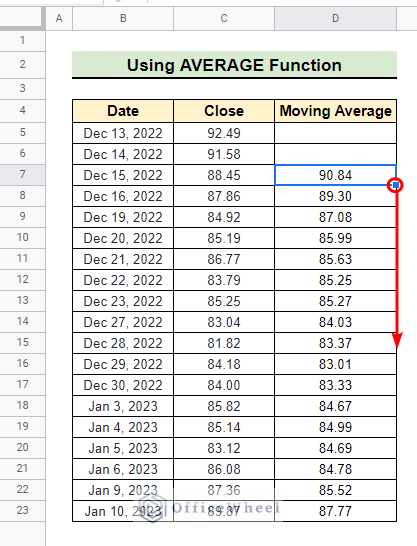
- Afterward, we use the fill handle tool to get the moving average of subsequent rows.
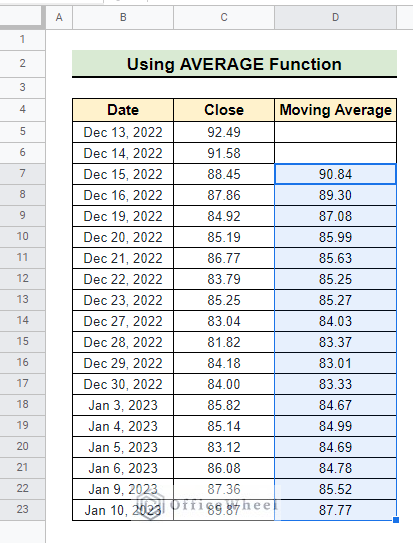
- Finally, we got the moving average for all the rows as follows.
II. Applying GOOGLEFINANCE Function
Another way of getting the moving average is using the GOOGLEFINANCE function in combination with the QUERY function and AVERAGE function. We can get the moving average of recent closing values of security directly in this way. However, we have to know the ticker of security used in Google Finance.
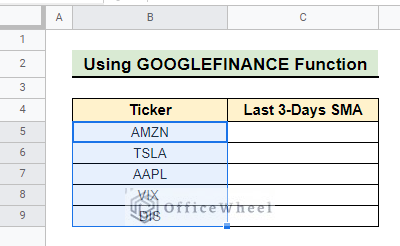
- Initially, we collect the ticker of a few well-known securities. Now, we want to know the last three days moving average of closing values.
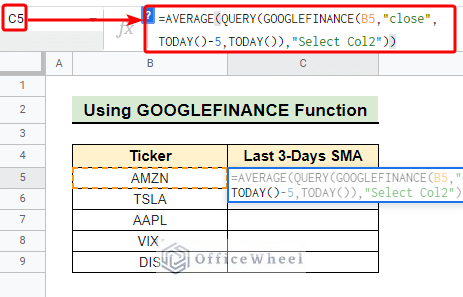
- To calculate the last three days’ simple moving average, we select cell C5 and insert the formula below in the formula bar.
=AVERAGE(QUERY(GOOGLEFINANCE(B5,"close",TODAY()-5,TODAY()),"Select Col2"))- Following, press the Enter key.
- As a result, we get the moving average closing prices of the security “AMZN”(AMAZON).
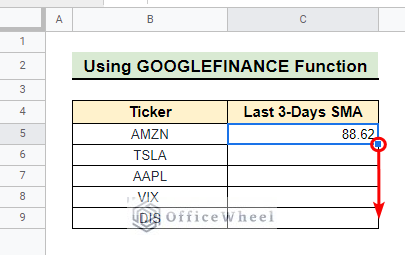
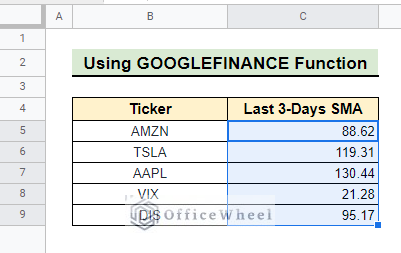
- Then we use the fill handle tool to get the last three days moving average of closing prices of stocks for the other companies.
Read More: How to Find 7-Day Moving Average in Google Sheets
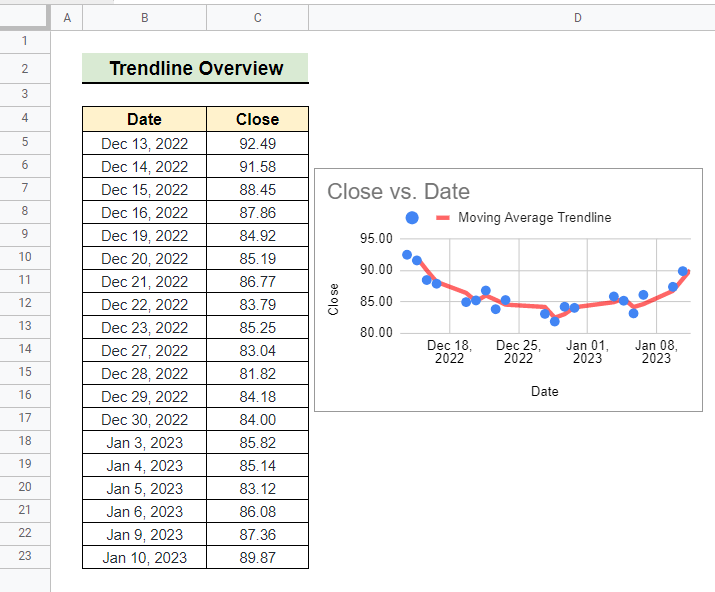
Step 3: Inserting Trendline
In this last step, we are going to insert the trendline of the moving average that we have already calculated.
- Initially, we select the data range as indicated.
- Then we go to Insert >> Chart from the menu bar.
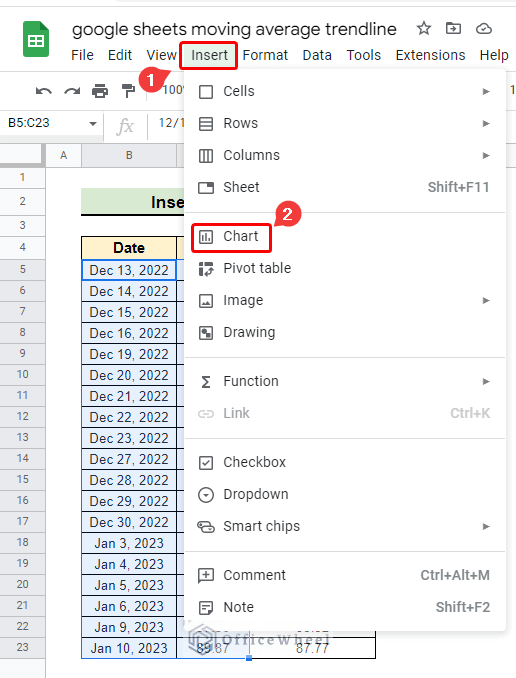
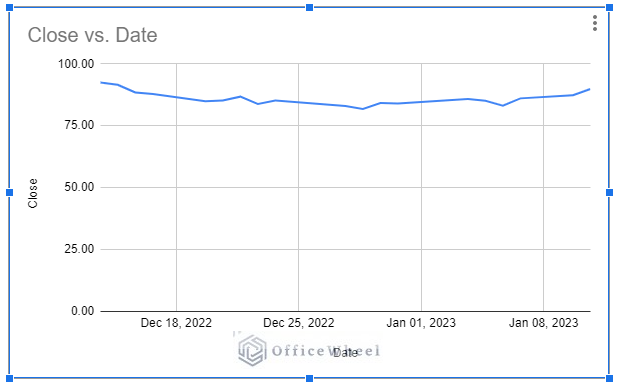
- As a result, the following chart is inserted in the current sheet with the Chart editor window opened at the top left corner.
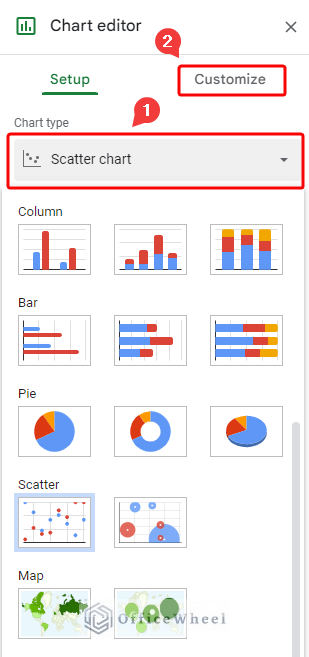
- Then we select Chart type within the Chart editor window.
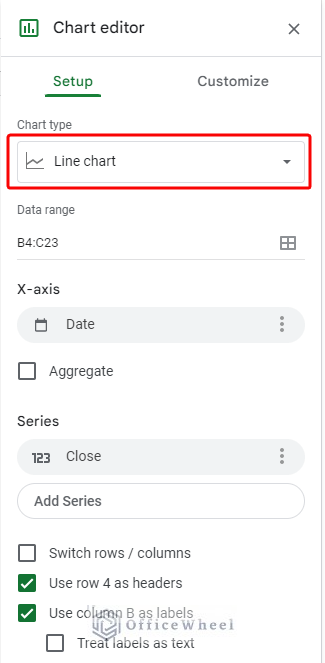
- Afterward, we chart the chart type from Line chart to Scatter chart and select Customize.
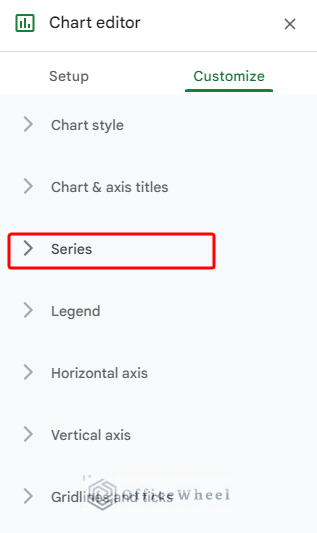
- Next, we select the Series as indicated to customize the already inserted chart.
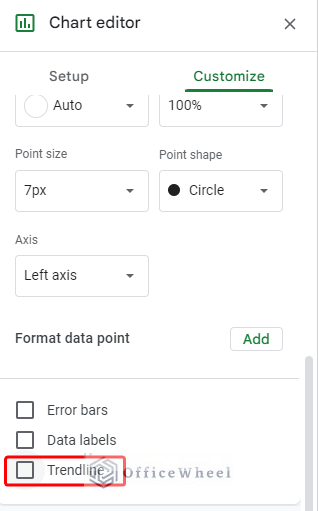
- Now we will add a trendline, so check the Trendline box as follows.
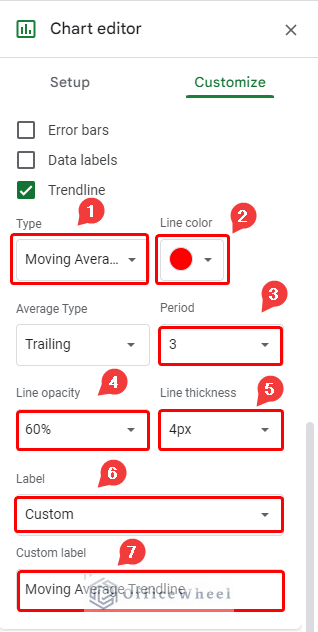
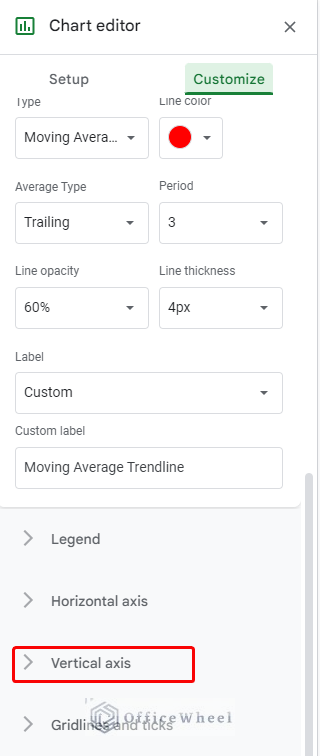
- After checking the Trendline box, we select the Type of the trendline as Moving Average.
- The Line color option is changed to red for clear visualization.
- Next, the Period option of the trendline is selected as 3 because we want to insert the trendline of three day moving average.
- The Line opacity option is changed to 60% to make the trendline eye soothing.
- Next, we change the Line thickness option to 4px.
- Finally, we select Label and set it to Custom.
- At last, we write down Moving Average Trendine in the Custom label box.
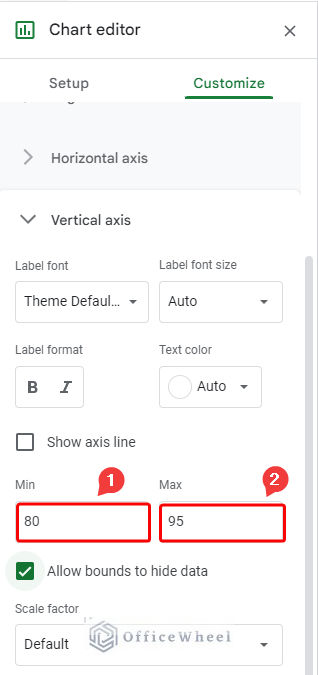
- Now we select Vertical axis option from the Chart editor window.
- Now we change Min value of the vertical axis to 80 and Max value to 95.
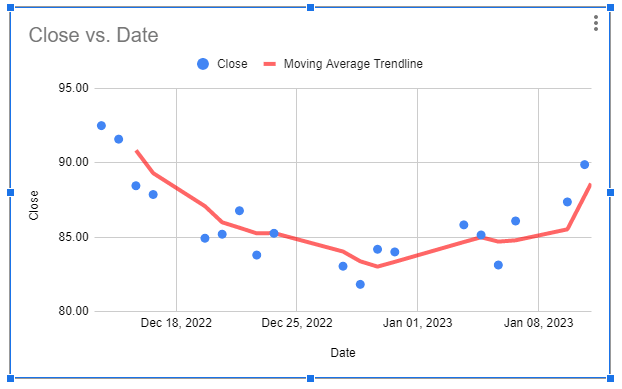
- All the above changes make the inserted chart as follows. We can easily identify the moving average trendline and closing price of stocks by the color difference.
Things to Remember
- Try to customize the moving average trendline based on your data for better visualization.
- Try to use the average function to calculate the moving average while working on your own data.
Conclusion
In conclusion, I firmly believe from now you can easily calculate and insert moving average trendline in Google Sheets. Further, If you face any issues in inserting moving average trendline when working on your data please feel free to comment below and I will try to reach out to you soon. Visit our website OfficeWheel for many more useful articles.