The Simple Moving Average (SMA) calculates the stock’s average price over a specific period of time by continuously summing up an agency’s stock prices and dividing it by the number of periods. SMA is incredibly helpful for analyzing stock prices and other types of data as well as for determining market trends. You might identify patterns in the data by using the 200-day moving average. It is determined by averaging an agency’s price over the past 200 days. In this article, I’ll demonstrate 2 simple ways to find the 200-day moving average in Google Sheets. Here is an overview of what we will achieve:
2 Quick Ways to Find 200-Day Moving Average in Google Sheets
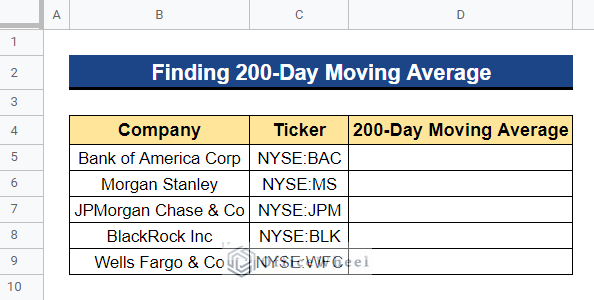
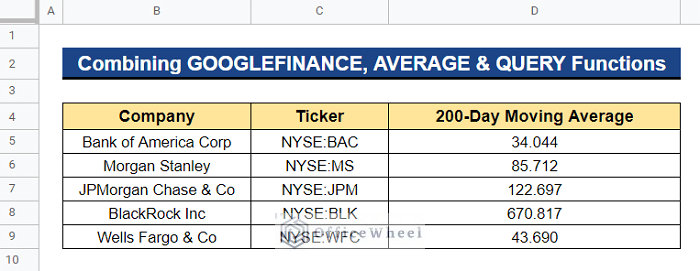
We’ll show you two simple ways to find the 200-day moving average in Google Sheets using the dataset below. In one column of the dataset is a list of financial corporation companies, and in a separate column are the tickers for each of those financial corporation companies. We now need to know the stock price’s 200-day moving average for each company in the dataset. Since we’re interested in the moving average, we’ll utilize the GOOGLEFINANCE function to get recent or previous historical data.
1. Combining GOOGLEFINANCE, AVERAGE and QUERY Functions
We can combine the GOOGLEFINANCE, AVERAGE, and QUERY functions to find the stock price’s 200-day moving average in Google Sheets. Here, the GOOGLEFINANCE function will retrieve the recent or past historical data of a company by using the ticker of the company. Then, the QUERY function will search for specified values. Afterward, the AVERAGE function will calculate the 200-day moving average.
Steps:
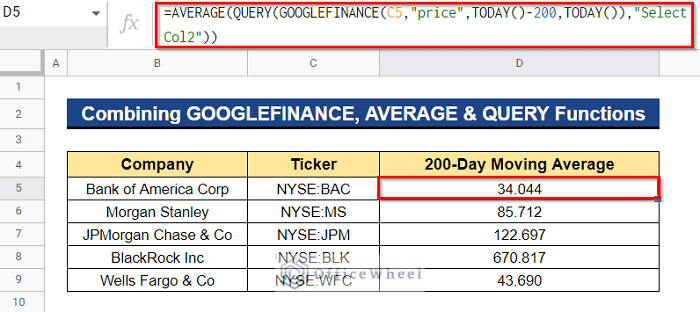
- Firstly, select a cell where you want to apply the formula to get the 200-day moving average of stocks for Bank of America Corp. In our case, we selected Cell D5. Next, enter the formula below and press Enter–
=AVERAGE(QUERY(GOOGLEFINANCE(C5,"price",TODAY()-200,TODAY()),"Select Col2"))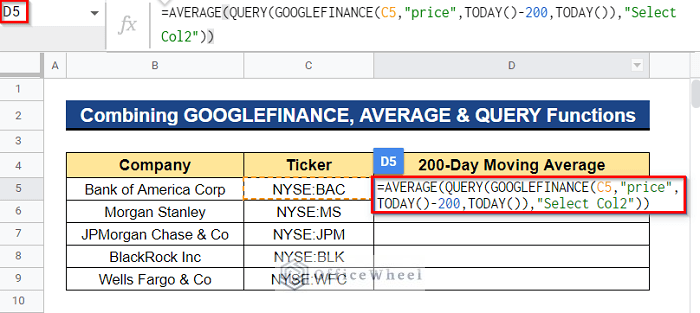
Formula Breakdown
- GOOGLEFINANCE(C5,”price”,TODAY()-200,TODAY())
The GOOGLEFINANCE function first retrieves the Bank of America Corp. stock prices for the last 200 days up to today. The ticker for the stocks that have been considered is located in Cell C5. The start date range is provided by the TODAY()-200 function, which represents the period beginning 200 days ago. The TODAY() function returns the current date, which serves as the end date for data retrieval.
- QUERY(GOOGLEFINANCE(C5,”price”,TODAY()-200,TODAY()),”Select Col2″)
After that, using the filter supplied by the Col2(which represents the 2nd column) parameter, the QUERY function runs a Google Visualization API Query Language search to choose data from the output of the GOOGLEFINANCE function.
- AVERAGE(QUERY(GOOGLEFINANCE(C5,”price”,TODAY()-200,TODAY()),”Select Col2″))
Finally, taking the QUERY result as input, the AVERAGE function calculates the average of each value in the column.
- As a result, you will get the stock’s latest 200-day moving average price for Bank of America Corp. Now, to apply the formula to the remaining cells, drag the Fill Handle icon downward.
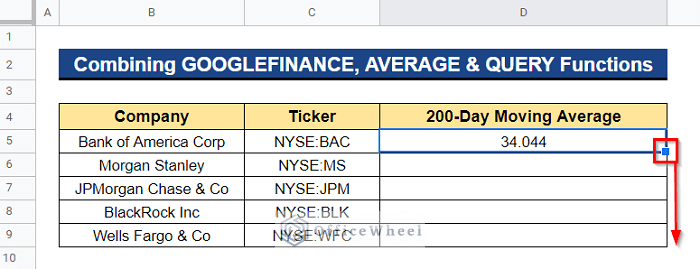
- Thus, we will receive the 200-day moving average of the stock prices for the listed companies in our dataset.
Read More: How to Find 50 Day Moving Average in Google Sheets
2. Merging GOOGLEFINANCE, AVERAGE and INDEX Functions
The 200-day moving average of the stock price may be found in Google Sheets by combining the GOOGLEFINANCE, AVERAGE, and INDEX functions. Here, the GOOGLEFINANCE function will use the company ticker to get recent or past historical data for a company. The values indicated by the time periods will then be returned by the INDEX function. Next, we will use the AVERAGE function to calculate the stock price’s 200-day moving average.
Steps:
- First, pick a cell to which you’ll use the formula to calculate the stock’s 200-day moving average for Bank of America Corp. In this instance, we selected Cell D5. After that, enter the following formula and hit Enter–
=AVERAGE(INDEX(GOOGLEFINANCE(C5,"price",TODAY()-200,TODAY()),,2))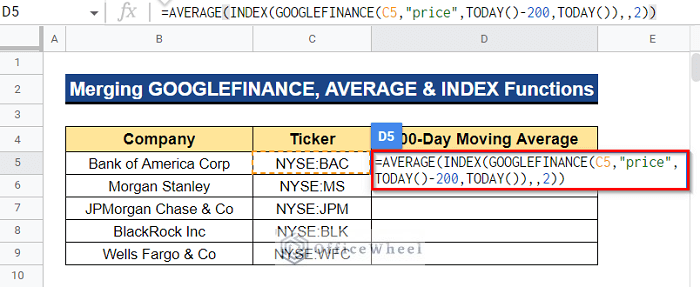
Formula Breakdown
- GOOGLEFINANCE(C5,”price”,TODAY()-200,TODAY())
The GOOGLEFINANCE function initially obtains the stock prices for Bank of America Corp. for the last 200 days up to the present day. Cell C5 contains the ticker for the stocks that have been taken into consideration. The TODAY()-200 function, which denotes the time span starting 200 days ago, provides the start date range. The TODAY() function returns the current date, which acts as the end date for data retrieval.
- INDEX(GOOGLEFINANCE(C5,”price”,TODAY()-200,TODAY()),,2)
The value from the output of the GOOGLEFINANCE function is then returned by the INDEX function. 2 instructs the formula to obtain the outcome from the column of the data range.
- AVERAGE(INDEX(GOOGLEFINANCE(C5,”price”,TODAY()-200,TODAY()),,2))
The AVERAGE function then computes the average of each value in the column using the INDEX result as input.
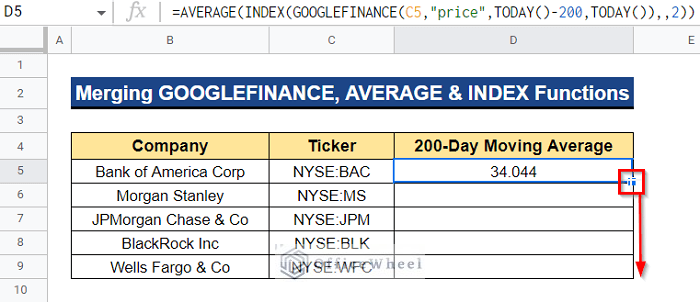
- You will thus receive the most recent 200-day moving average price for Bank of America Corp. By dragging the Fill Handle symbol downward, you can now apply the formula to the remaining cells.
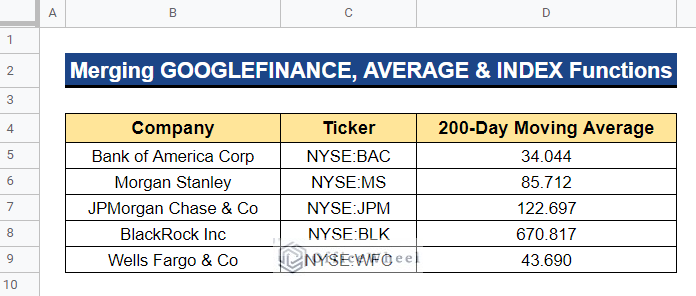
- As a result, we will get the stock prices’ 200-day moving average for the listed companies in our dataset.
Read More: How to Find 7-Day Moving Average in Google Sheets
Conclusion
And with that, this article has come to an end. To assess and keep track of market fluctuations, using Google Sheets’ 200-day moving average is a useful tool. To calculate the 200-day moving average, you can employ any of the two approaches. In the comment section below, please feel free to leave any questions or recommendations. Visit our website, Officewheel.com, to read more of these handy Google Sheets articles.