Latest Posts

Conditional Formatting Between Two Values in Google Sheets

Sometimes while working on a dataset you need to highlight some specific data so that you get that data quickly. But completing this work manually is ...

How to Insert Lines Between Cells in Google Sheets

Google Sheets offers the ability to add lines between cells to make data more organized and easy to read. This feature is particularly useful in ...

How to Subtract a Percentage in Google Sheets

In Google Sheets, you can subtract thousands of data at a time by applying functions and formulas. Though there is no specific function for ...

How to Print Row Numbers in Google Sheets (4 Useful Methods)

Sometimes we need to print the row numbers of our dataset in Google Sheets. But you can’t print the row numbers by default because rows and columns ...

How to Freeze Panes in Google Sheets (3 Simple Ways)

If you have a large dataset with many rows and columns, it can be difficult to understand if some of the rows and columns are not visible. Freezing ...

How to Change Title of Pie Chart on Google Sheets

Google Sheets offers a variety of visualization possibilities, the Pie Chart being one of them. Using this tool, you may display data and understand ...

How to Apply Barcode Font in Google Sheets (With Easy Steps)

Barcodes are a popular method for reading data in a variety of industries. These simple lines and spaces can be used to encode product prices, ...

How to SUMIF Between Two Dates in Google Sheets (3 Ways)

Efficiently tracking business performance is crucial, and one way to do this is by using the SUMIF function in Google Sheets to quickly and easily ...

How to Change Pie Chart Percentage to Number in Google Sheets

Suppose you are working on a dataset that contains every month's sales and you need to analyze this data. Imagine how hard it could be. Because if ...

How to Add Different Standard Deviation Bars in Google Sheets

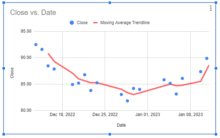
Sometimes you need to show standard deviation to analyze your data. In Google Sheets, it is quite easier to insert standard deviation in the graph. ...

How to Print to PDF Using Apps Script in Google Sheets

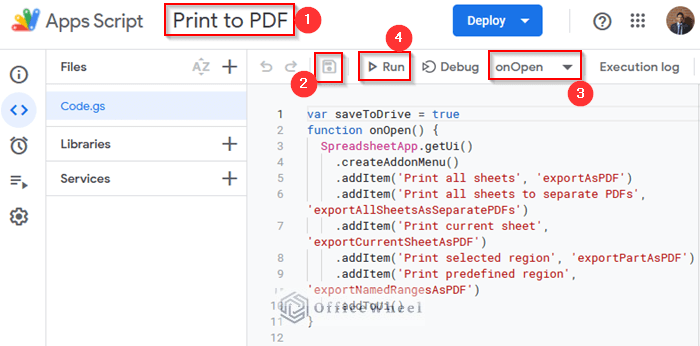
Using Google Sheets' print command makes it easy to print any sheet in PDF format. But there is a distinctive feature in Google Sheets like the Apps ...

How to Insert Not Equal to Symbol in Google Sheets (4 Easy Ways)

We frequently require the Not Equal to symbol (≠) to depict a comparison between the two values which are unequal. But unfortunately, Google Sheets ...

How to Split String into Array in Google Sheets (3 Easy Methods)

Google Sheets has a couple of effective spreadsheet tools that allow you to split a string of text into an array of individual elements. Knowing how ...

How to Average Cells from Different Sheets in Google Sheets

In Google Sheets, calculating the average is the most common and basic function. We use this equation most often for different purposes. So, in this ...

How to Insert Moving Average Trendline in Google Sheets

In order to see the current trend of any business parameter, moving average trendlines are crucial. It identifies the current trend direction and ...

OfficeWheel
Logo