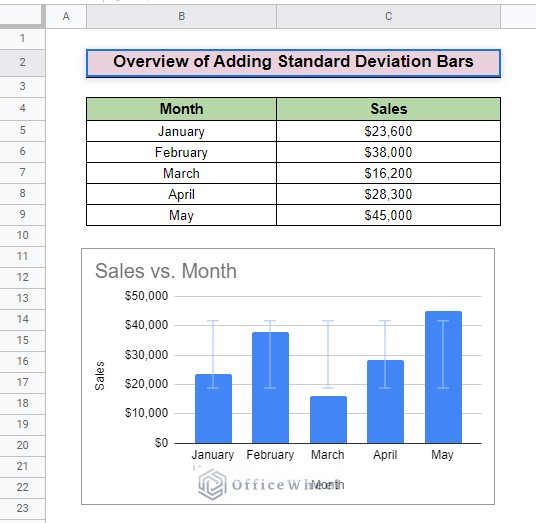
Sometimes you need to show standard deviation to analyze your data. In Google Sheets, it is quite easier to insert standard deviation in the graph. In this article, we will show how to add different standard deviation bars in Google Sheets.
Sample Spreadsheet to Practice
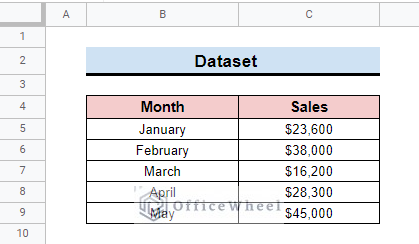
You may copy the spreadsheet below and practice by yourself.
Steps to Add Different Standard Deviation Bars in Google Sheets
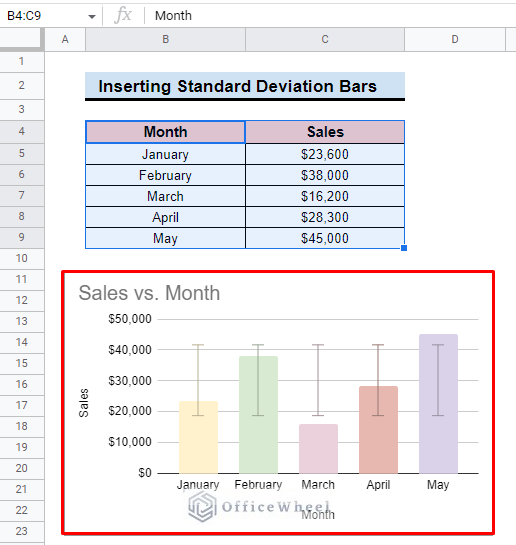
The standard deviation bars show how much the data deviates from the standard value in the graph. To insert standard deviation in Google Sheets, you have to go through some essential steps. Here, we develop a dataset that presents sales information.
Step 1: Inputting a Graph
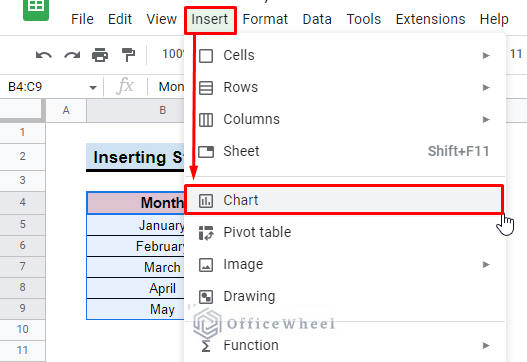
To create a graph, we use the columns Month and Sales.
- First, we select the two columns and go to the Insert feature. Then select the Chart option.
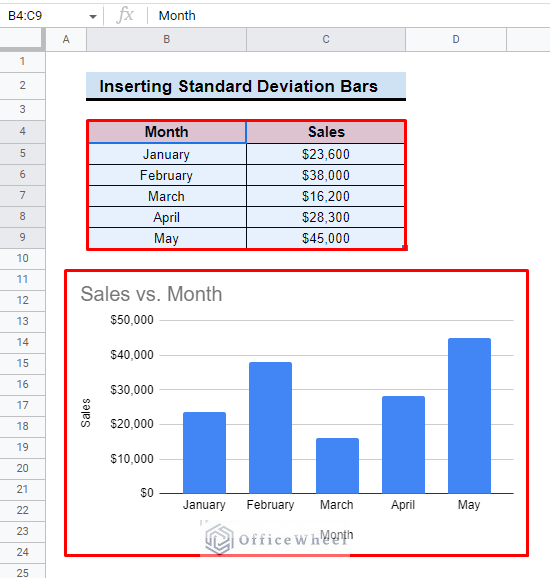
- After clicking on the Chart option, you will see a chart inserted into your spreadsheet.
Step 2: Inserting Standard Deviation Bars
The standard deviation bars add to the graph to show the deviation from the standard value. So, to input the standard deviation bar in the graph,
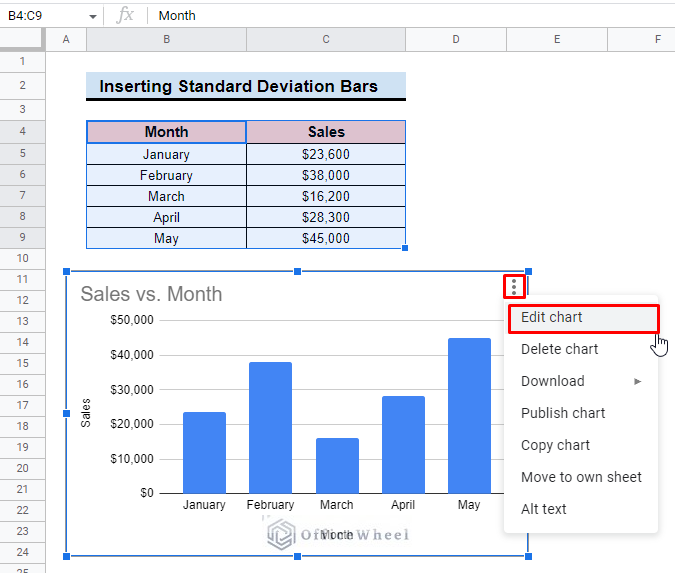
- In the beginning, go to the three-dot menu icon in the top right corner of the graph and select the Edit chart option.
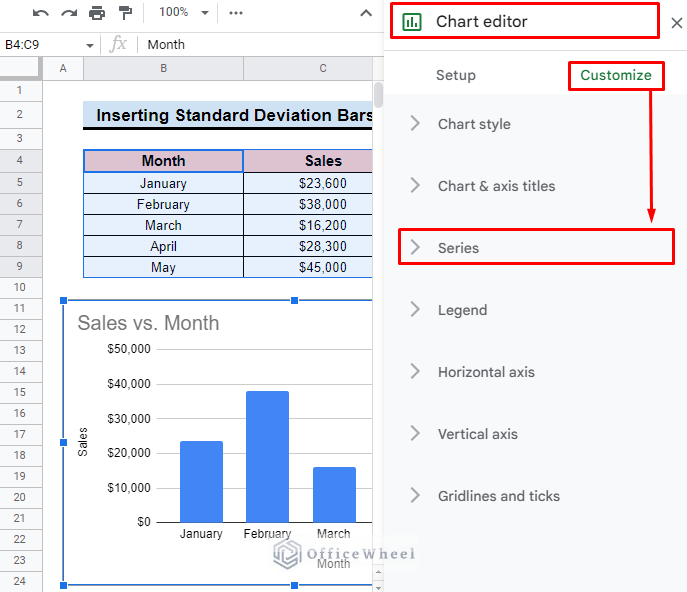
- In the Chart editor feature goes to the Customize bar and click to expand the Series option.
- At the bottom of the Series section, you will find the Error bars option.
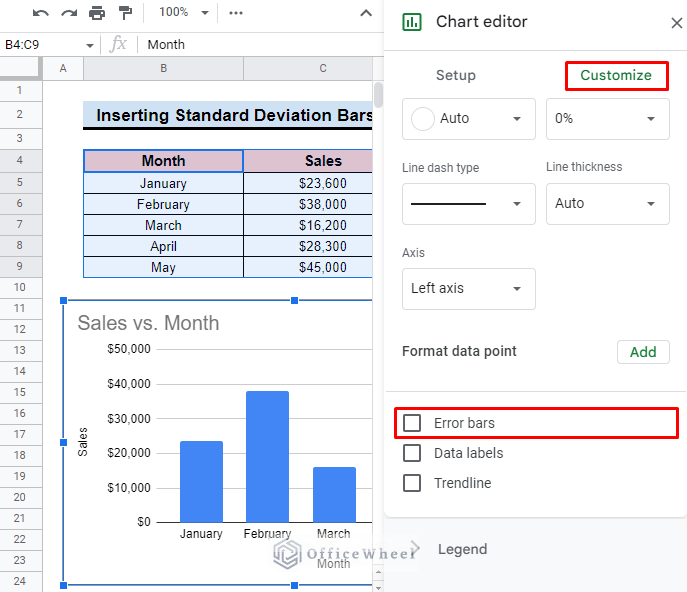
- Now, check on the Error bars and find the types of error bars from the drop-down list. This will bring out the default error bar over each data.
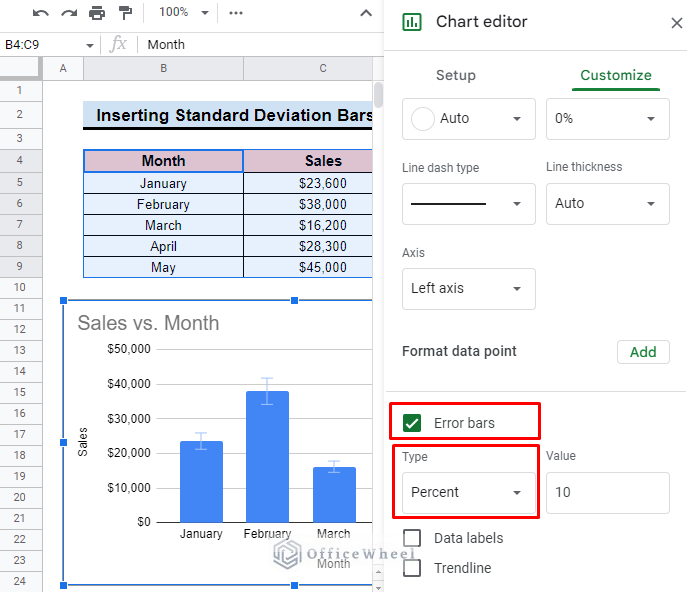
- This will also present us with the Type section.
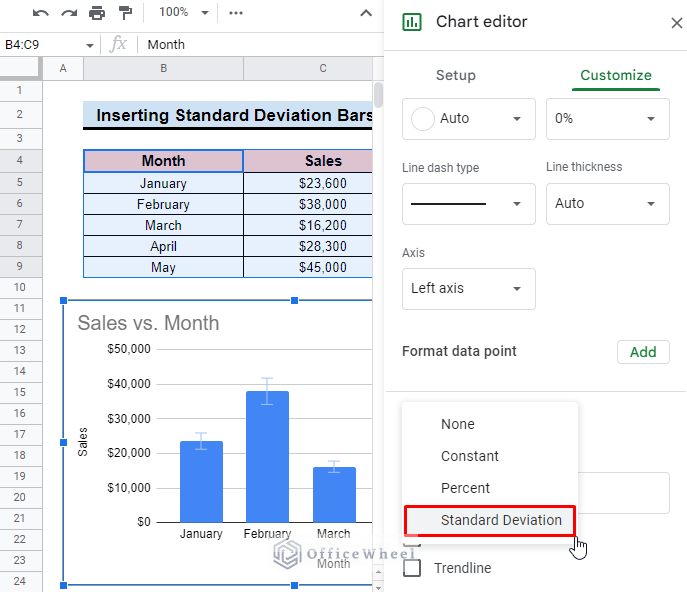
- After that, select the Standard Deviation option from the Type drop-down.
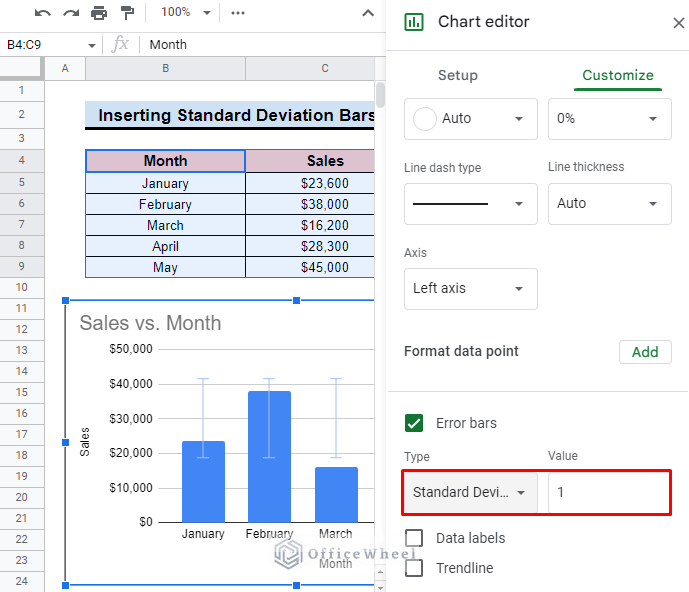
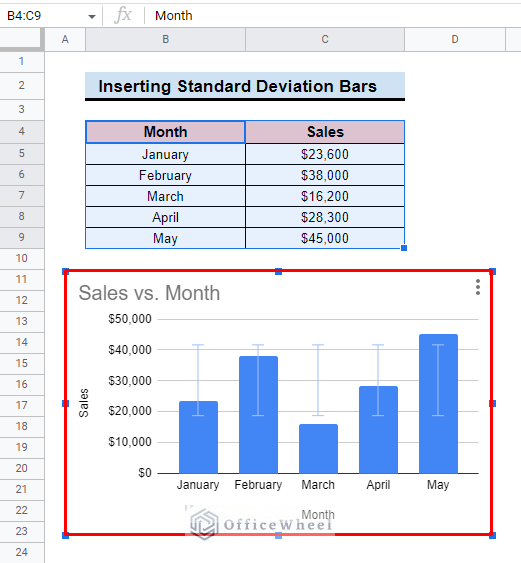
- Finally, you will find the standard deviation bars added to the selected graph.
Read More: How to Calculate Standard Deviation in Google Sheets
Step 3: Enhancing Visibility
When you input the Standard deviation bars, you will find the graph by default formatting. But luckily in Google Sheets, you can change the formatting of the graph and enhance it visibility. To do so,
- First, open the Chart Editor by double-clicking the graph.
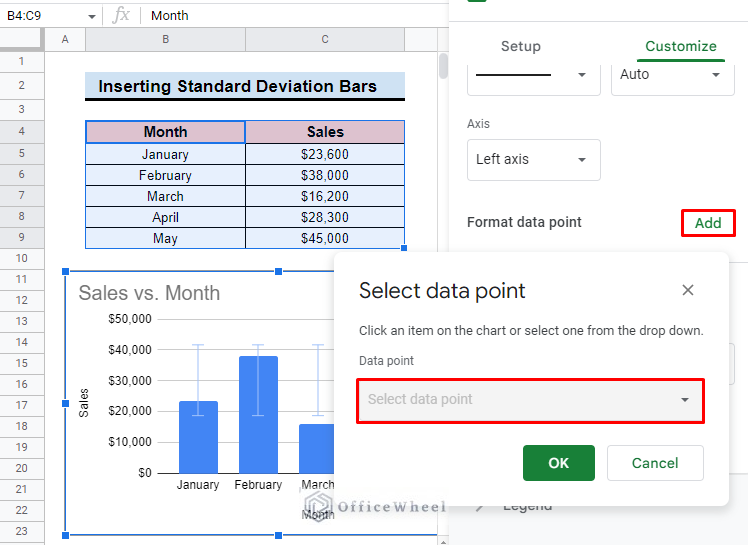
- Here, in the Customize bar select the Format data point.
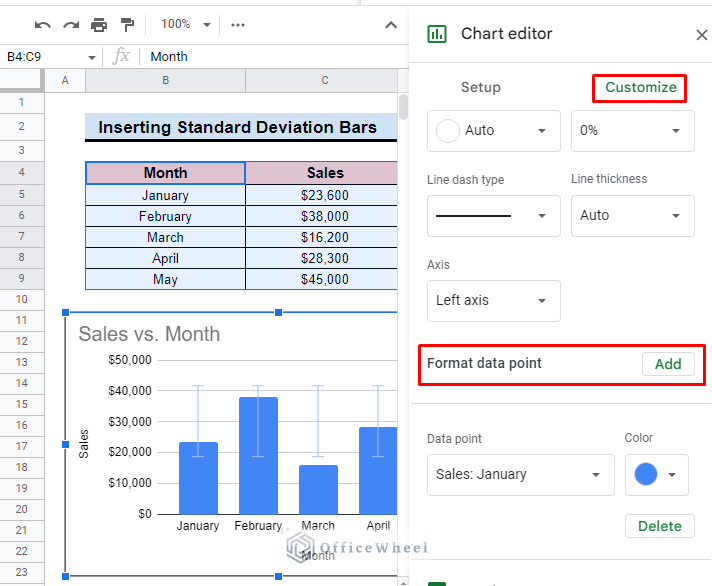
- Then click on Add option and you will find the Select data point box.
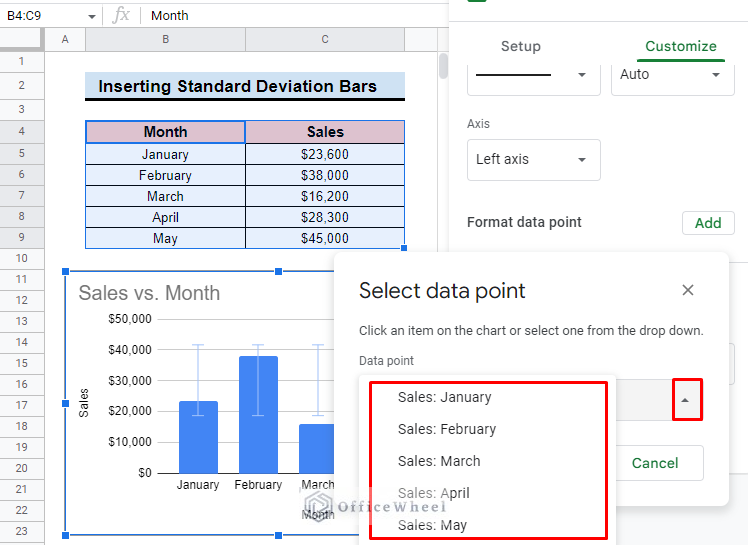
- After that, click on the dropdown list in the Select data point box and find options from the graph.
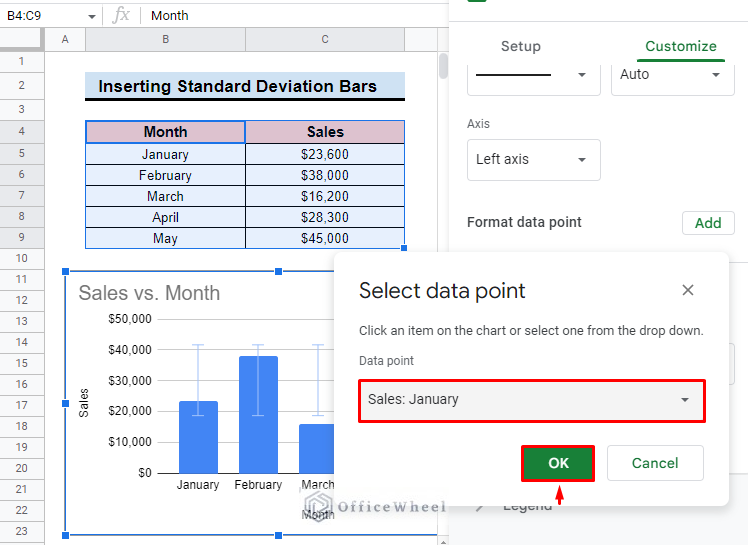
- Then select any option from them and press OK. Here, we select January as an example.
- Additionally, you can also change the color of the bar to make it more visual. Here, we select a specific color for the sales value of January.
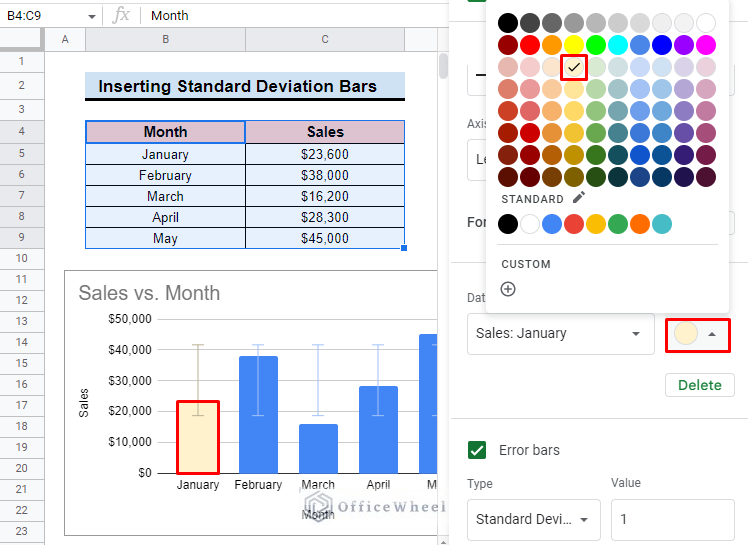
- By applying the same process repeatedly, you can change the bar formatting and enhance the visualization of the standard deviation bars.
Read More: Calculate Standard Deviation of Weighted Variables in Google Sheets
Things to Remember
- You can use any type of chart to show standard deviation bars, but a column chart is preferable.
Conclusion
We hope now you will clearly understand how to add different standard deviation bars in Google Sheets. For further exploration of Google Sheets, you can visit the OfficeWheel website. Moreover, If you have any queries feel free to comment.