Formulas

How to Add Different Standard Deviation Bars in Google Sheets

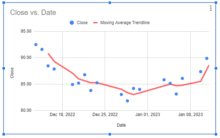
Sometimes you need to show standard deviation to analyze your data. In Google Sheets, it is quite easier to insert standard deviation in the graph. ...

How to Average Cells from Different Sheets in Google Sheets

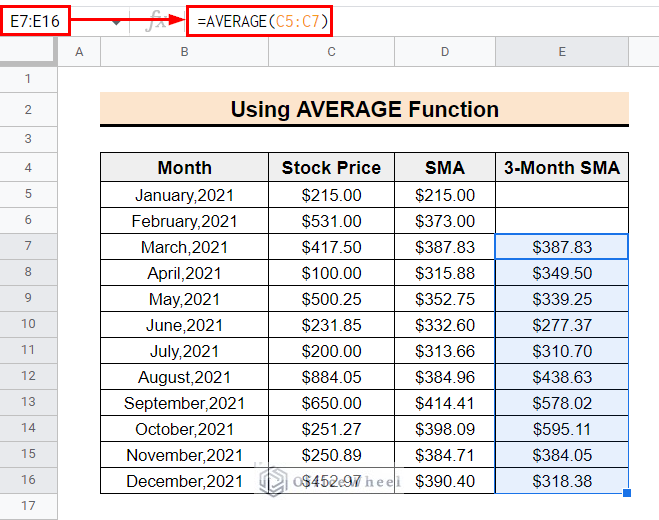
In Google Sheets, calculating the average is the most common and basic function. We use this equation most often for different purposes. So, in this ...

How to Insert Moving Average Trendline in Google Sheets

In order to see the current trend of any business parameter, moving average trendlines are crucial. It identifies the current trend direction and ...

How to Find Unique Values Between 2 Columns in Google Sheets 

During data analysis, data repetition is a significant problem. To get rid of this problem, you must create a unique dataset free from any type of ...

How to Calculate Percentage Change in Google Sheets (4 Ways)

Learn how to easily calculate percentage change in Google Sheets. Use this powerful tool to track the performance of your data and make informed ...

Calculate Percentage Difference Between Two Numbers in Google Sheets

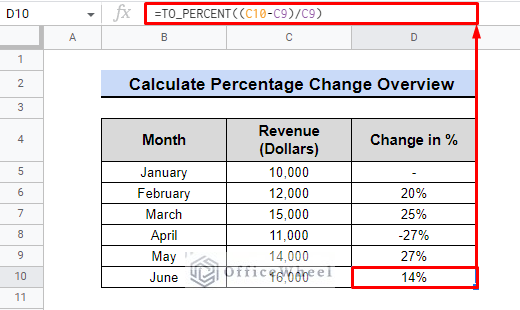
One of the easiest ways to determine how much two numbers differ proportionally is to calculate the percentage change. It's crucial to understand the ...

Google Sheets Calculated Field Percentage of Total in Pivot Table

Suppose you are working on a project where you need to keep track of the profit or sales percentage of your company. But tracking everyday ...

How to Find Correlation Coefficient in Google Sheets

A correlation coefficient is a metric that expresses a correlation, or a statistical link between two variables, in numerical terms. In brief, ...

How to Split Address in Google Sheets (3 Easy Methods)

When working with addresses in Google Sheets, sometimes you may need to split a large address into its individual components such as street, city, ...

How to Calculate Time Between Dates in Google Sheets (6 Ways)

Calculating the time between dates may be beneficial for company operations in a number of different circumstances. Project management is a good ...

How to Use IFS Between Two Numbers in Google Sheets

The IFS function in Google Sheets helps to check multiple conditions at once, for example, it can be used to check if a value falls between two ...

How to Calculate Standard Deviation in Google Sheets

While working on a dataset maintaining unusual numbers or unnecessary values is very important. As these values make an impact on the dataset. ...

How to Calculate Simple Moving Average in Google Sheets

The Simple Moving Average (SMA) is a statistical operation that we can use to understand the market trend and in market forecasting. It is very ...

How to Find Frequency in Google Sheets (2 Easy Methods)

Frequency is a metric that gives us the idea of how frequently a particular data appears within a dataset. Calculating frequency is often necessary ...

How to Calculate Weighted Moving Average in Google Sheets

Weighted Moving Average (WMA) is a statistical parameter that we frequently use in business and scientific research. We use it as an indicator of ...

OfficeWheel
Logo