While working on a dataset maintaining unusual numbers or unnecessary values is very important. As these values make an impact on the dataset. Tracking these issues manually is nearly impossible when the dataset is complex or huge. Even if the dataset is small then tracking all these pieces of information is quite time-consuming and tiring as well. We can solve this problem easily by using standard deviation in google sheets. In this article, we will learn how to calculate standard deviation in google sheets. So, Let’s Start.
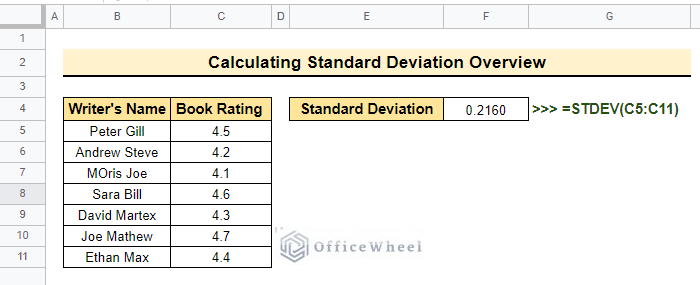
Here is the overview of calculating the standard deviation which represents the application of the STDEV function. You will learn more about the STDEV function after following the total article.
A Sample of Practice Spreadsheet
You may copy the spreadsheet below and practice by yourself.
What Is Standard Deviation
The standard variation measures the variation between a specific value from the given dataset and the average or mean value. Standard deviation is a very important method to measure the variation that values shown from the average or the mean value.
Introduction to STDEV Function in Google Sheets
Google sheets represent the STDEV function as the standard deviation. We can calculate the standard deviation of a dataset using the STDEV function.
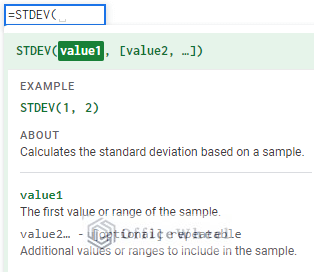
Syntax
The syntax of the STDEV function is like below.
STDEV(value1,[value2,.....])
Arguments
- value1: this represents the first value or the first range to get the standard deviation
- value2: This represents the additional values if there is more than one dataset.
Return Value
Returns the standard deviation of the selected dataset.
Step by Step Procedures to Calculate Standard Deviation in Google Sheets
The dataset below contains Writer’s Name and Book Rating. Now we will calculate the standard deviation for the total rating of the book. using the method shown below.
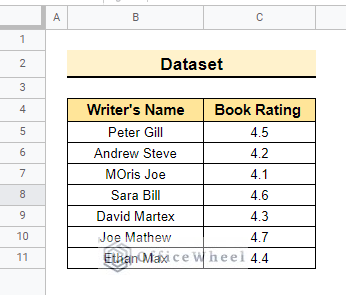
Step 1: Prepare the Dataset
At the very beginning, you have to prepare your dataset to apply the required formula.
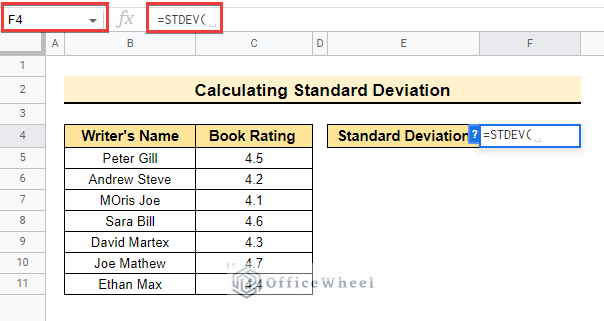
- To do this, first, modify the dataset and select cell F4 to enter the formula.
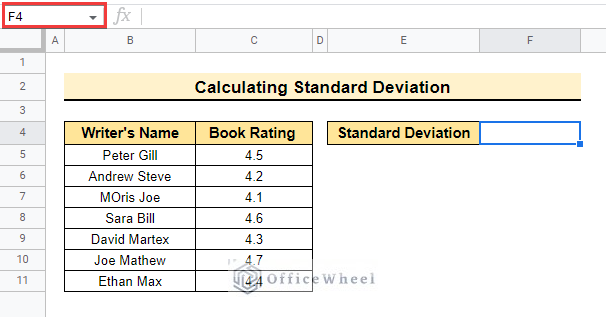
- After that, attempt to enter the formula in cell F4 so that the process can be executed.
Step 2: Apply the Formula
- Then, enter the formula into cell F4 and select the range C5:C11 to get the standard deviation of the total dataset.
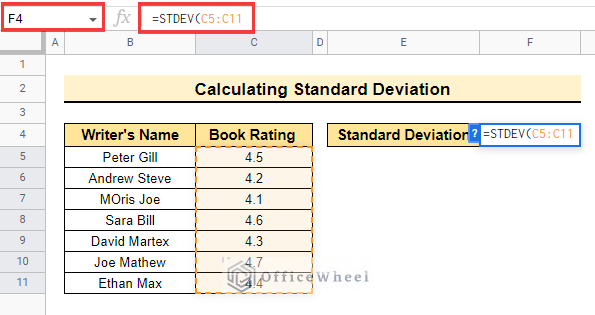
- Now press Enter to complete the formula and the standard deviation for the total dataset is shown below.
- Now the overall formula will be as below.
=STDEV(C5:C11)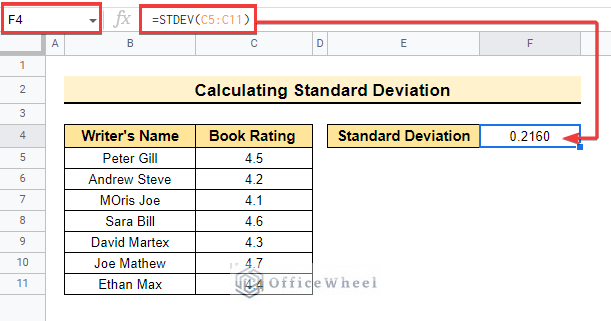
Read More: How to Add Different Standard Deviation Bars in Google Sheets
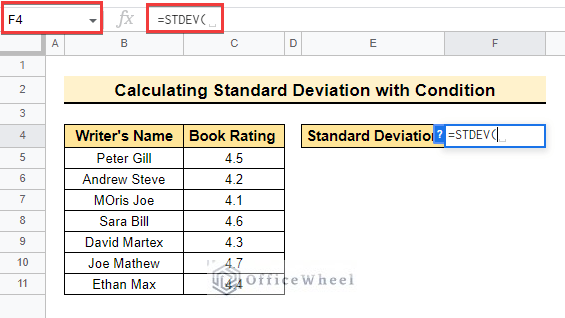
How to Calculate Standard Deviation with Conditions Applied in Google Sheets
Here, we will calculate the standard deviation for the same dataset but with a condition applied. Therefore, we want to calculate the standard deviation for only those values which are greater than 4.3. Now follow the steps below to execute this method.
📌 Steps:
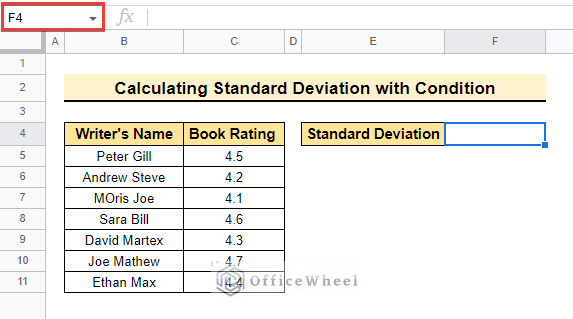
- Initially, modify the dataset to calculate the standard deviation.
- Then, select cell F4 to execute the process and get the output in this cell.
- Following, enter the formula in cell F4 as below.
- Moreover, enter the FILTER function and select the range C5:C11 to get the standard deviation.
- The FILTER function will filter the values which are not fit for the condition.
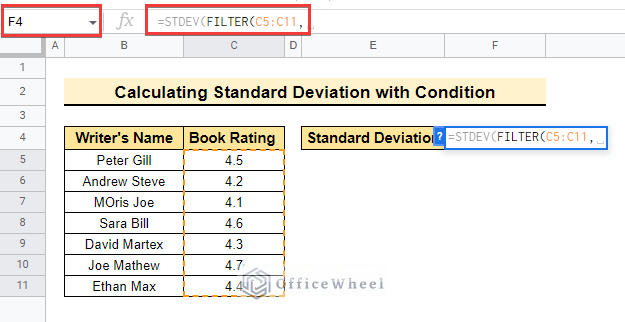
- Now, apply the condition (C5:C11>4.3) this condition represents getting the value of those numbers which are greater than 4.3. To execute the condition select range C5:C11 and write down the rest of the part manually.
- Finally, complete the bracket and execute the formula.
- So, the formula will be as follows.
=STDEV(FILTER(C5:C11,C5:C11>4.3))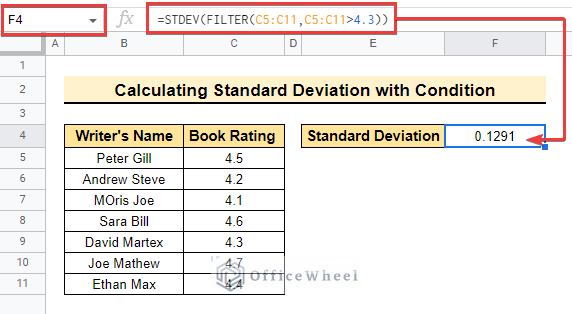
Read More: Calculate Standard Deviation with IF Condition in Google Sheets
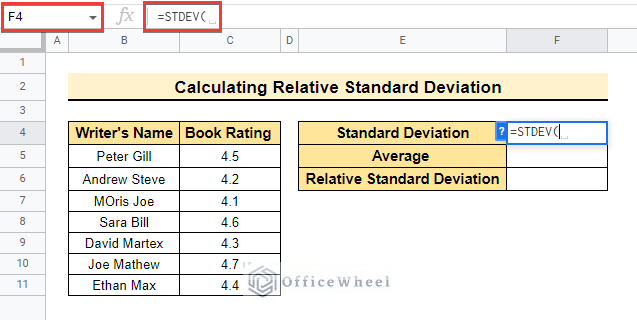
How to Calculate Relative Standard Deviation in Google Sheets
Furthermore, we will calculate the relative standard deviation using the same datasheet. So, follow the below steps to execute this process.
📌 Steps:
- In the beginning, select cell F4 to enter the STDEV function.
- Then, select the range C5:C11 and multiply the standard deviation by 100 to get the value of the standard deviation. So, the final formula should be like the following.
=STDEV(C5:C11)*100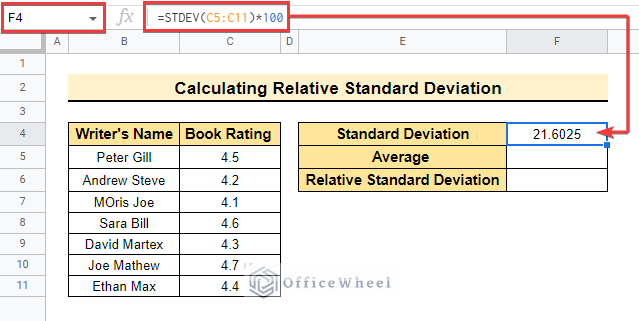
- After that, select cell F5 and enter the AVERAGE function.
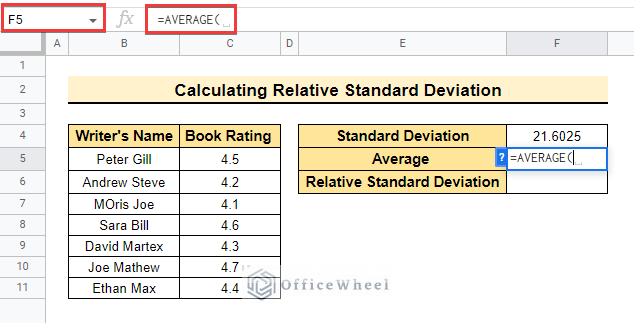
- Select range C5:C11 to get the average value of the dataset as below. So, the formula will be like below.
=AVERAGE(C5:C11)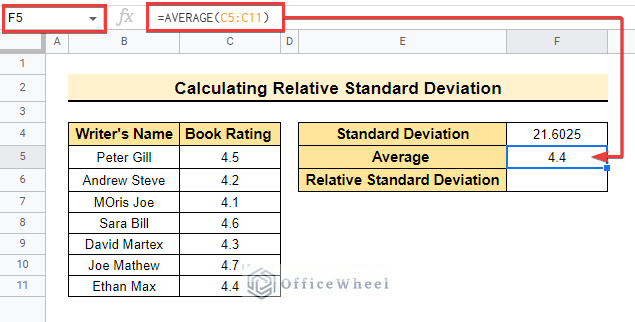
- Finally, divide the value of cell F4 by the value of cell F5 and get the relative standard deviation.
- Find the overall formula below.
=F4/F5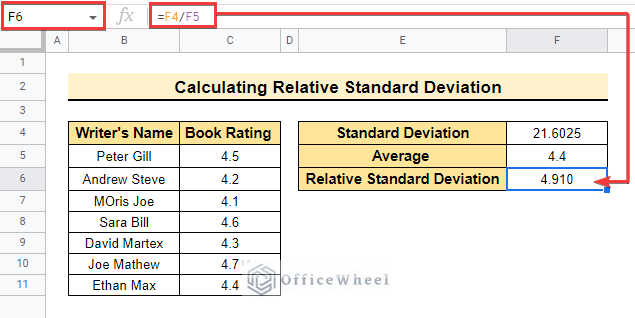
Read More: Calculate Standard Deviation of Weighted Variables in Google Sheets
Other Standard Deviation in Google Sheets
Google sheets contain other types of standard deviation which are the same formula for different situations. Now, the functions are below.
- The STDEVP function: The STDEVP function is used for calculating the standard deviation of a population which is represented by the P in the function. Moreover, the Population represents a group or a set of all the data.
- The STDEVA function: The STDEVA function represents the standard deviation of a sample with the text value (0). Therefore, the sample is a small part of a huge dataset or a group of data.
- The STDEVPA function: The STDEVPA function represents the standard deviation of a population with the text value (0).
Things to Remember
- Standard deviation is the measurement of the variation of the average value and selected value so it is measured for different parameters.
- You can also measure the standard deviation with a condition.
Conclusion
In this article, we explained how to calculate standard deviation in Google Sheets with practical examples. Hopefully, the methods will help you to apply these functions to your own dataset. Please let us know in the comment section if you have any further queries or suggestions. You may also visit our OfficeWheel blog to explore more Google Sheets-related articles.