Suppose you are working on a project where you need to keep track of the profit or sales percentage of your company. But tracking everyday percentages is not only challenging but also after some time when the dataset is quite big this part is nearly impossible to complete manually. Moreover, you can also track the data easily by using a pivot table as a pivot table can summarize data easily. In this article, we will learn how to get Google Sheets calculated field percentage of total in pivot table. So, let’s start.
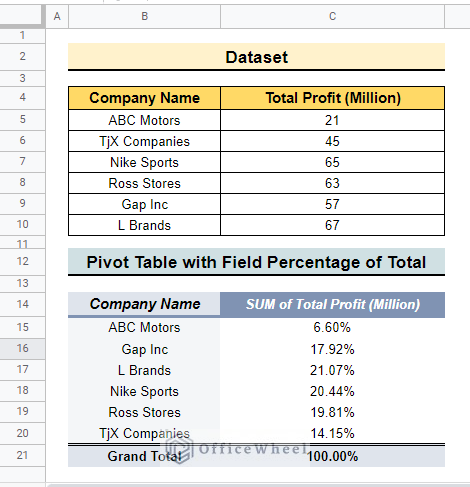
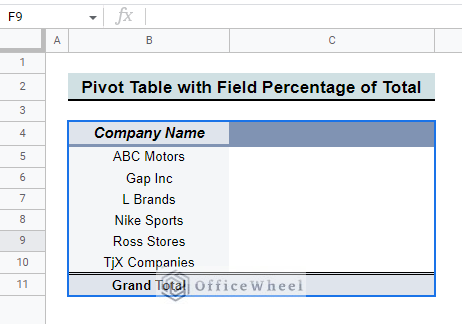
The above screenshot is the overview image to calculate the percentage of Total in google sheets. You will know more about the pivot table and this process after you go through the total article.
A Sample of Practice Spreadsheet
You may copy the spreadsheet below and practice by yourself.
What Is Pivot Table
A pivot table is a tool that summarizes the data with the selected rows, columns, values, etc. For example, if your dataset contains daily profit and by the end of the month you need to summarize your data Then, the pivot table is the best way to calculate the value. With a Pivot table, you can calculate the sum of data, count data, and summarize data. It is useful because It can analyze data as easily as analyzing numbers.
Step by Step Procedures to Calculate Field Percentage of Total in Pivot Table in Google Sheets
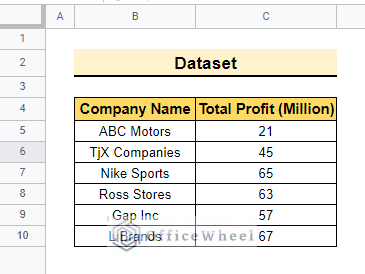
The Dataset below contains Company Name and Profit. Here, we will show how to calculate field percentage of total profit in pivot table. So, let’s follow the steps below.
Step 1: Create a Pivot Table
Here, we will create a pivot table to insert the data in the table,
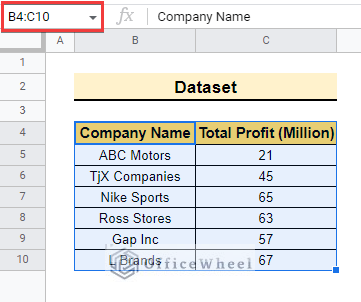
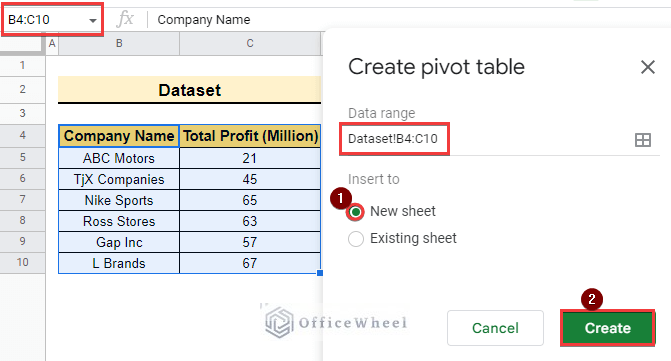
- First, Select the dataset with the header column so the range is B4:C10.
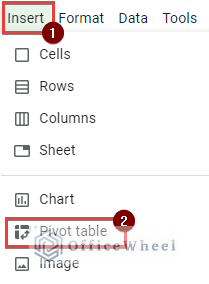
- Then, select Insert >> Pivot table from the menu bar as below.
- After that, “Create pivot table” window will pop up. With the selected area of the dataset.
- Now, select New sheet from “Insert to” and click the Create button to create a pivot table.
- Following this, a new pivot table is created in another sheet.
Read More: How to Make a Percentage Chart in Google Sheets (3 Ways)
Step 2: Modify Pivot Table
Now, we will edit the pivot table to get the percentage value of the total.
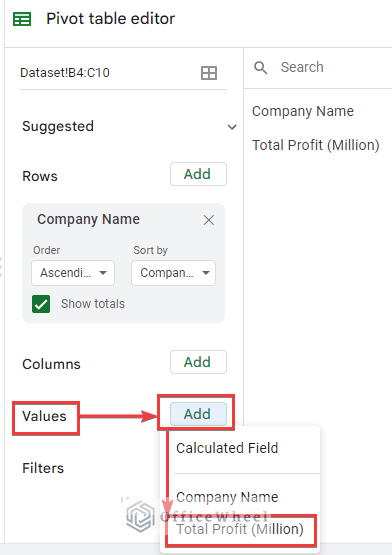
- Now, put the data into “Pivot table editor” below to get the percentage of total profit.
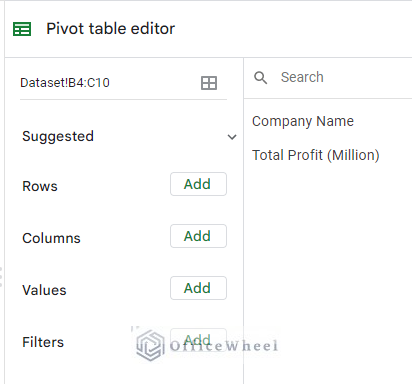
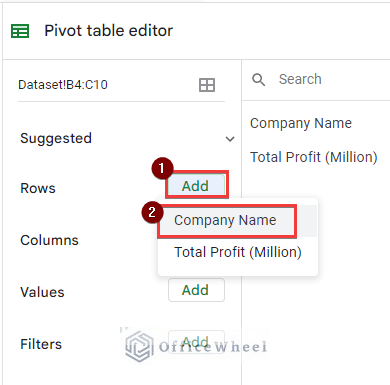
- Therefore, select Add beside Rows and options will pop up as below.
- Complete this part by selecting Company Name, so that the company name appears in the row.
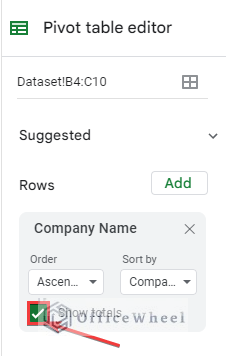
- Now the company name is added to the row and select Show totals so that it shows the total value.
- In the end, the pivot table will show values as follows.
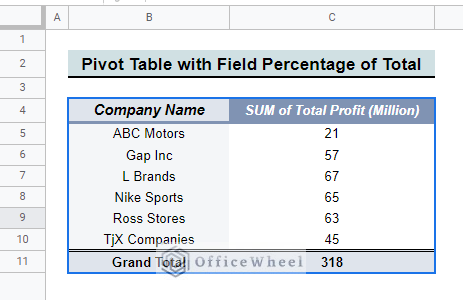
- Now, similarly, select “Add” beside “Values” and select Total Profit (Million) to complete the pivot table.
- Therefore, the pivot table will show the value as below.
- After that, select “% of grand total” from “Show as” so that, it shows the percentage of total profit.
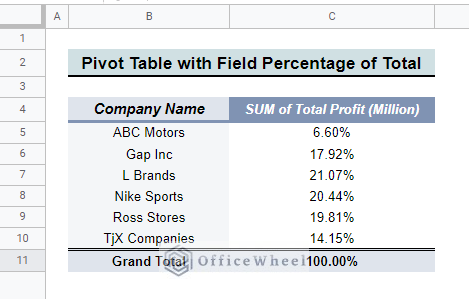
- Finally, the pivot table is complete and shows the percentage of total profit.
Read More: How to Calculate Percentage in Google Sheets (4 Ideal Examples)
Things to Remember
- Once you create the pivot table you cannot edit the main data.
- A pivot table is useful when the dataset is huge and complex. It will simplify your work.
- The “Edit” option will only appear when the “Pivot table editor” is not shown in the google sheets.
Conclusion
In this article, we explained how to find Google Sheets calculated field percentage of total in pivot table with proper steps. Hopefully, the method will help you to apply these features to your own dataset. Please let us know in the comment section if you have any further queries or suggestions. You may also visit our OfficeWheel blog to explore more Google Sheets-related articles.
Related Articles
- How to Subtract a Percentage in Google Sheets
- Change Pie Chart Percentage to Number in Google Sheets
- How to Calculate Percentage Change in Google Sheets (4 Ways)
- Remove Percentage Sign in Google Sheets (6 Ways)
- How to Use TO_PERCENT Function in Google Sheets
- Calculate Percentage Increase in Google Sheets (4 Ways)