AVERAGE Function

How to Insert Error Bars in Google Sheets (3 Practical Examples)

Suppose you are working on the projection of next year's valuation of your company. You need to calculate this year’s data for this projection. But ...

How to Use AVERAGE Function in Google Sheets (4 Examples)

The AVERAGE function is one of the basic and useful functions in Google Sheets. It helps the users to get an arithmetic mean of a set of numerical ...

Calculate Standard Deviation with IF Condition in Google Sheets

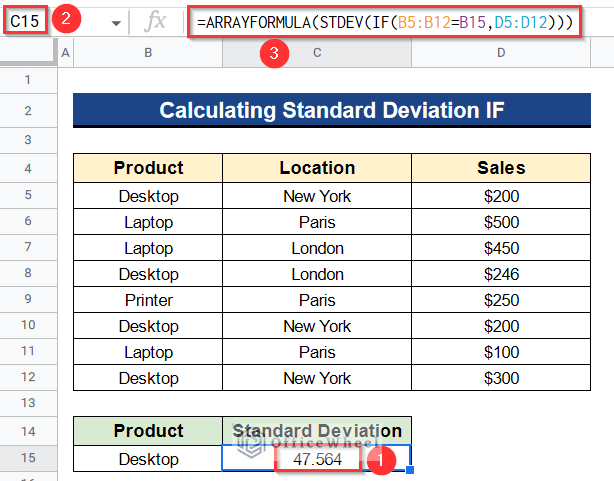
Standard deviation is a famous statistical tool in Google Sheets that we use often to measure the spread of values from the actual average values. We ...

How to Find 200-Day Moving Average in Google Sheets (2 Ways)

The Simple Moving Average (SMA) calculates the stock's average price over a specific period of time by continuously summing up an agency's stock ...

How to Find 7-Day Moving Average in Google Sheets

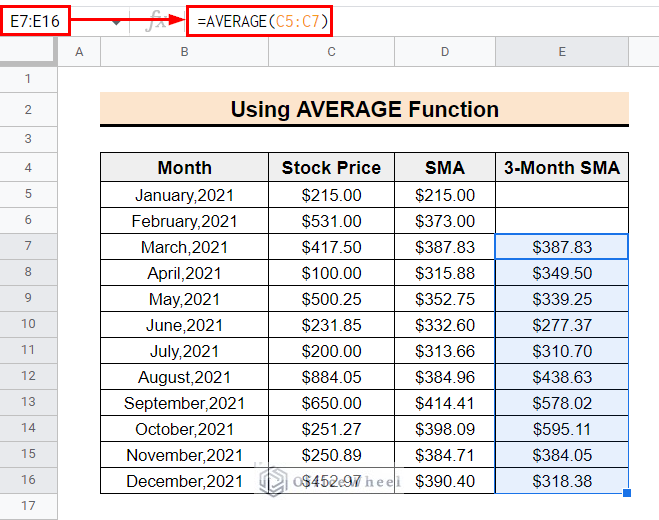
The Simple Moving Average (SMA) constantly adds up an agency's closing price and divides the sum by the number of periods to get the average price of ...

How to Average Cells from Different Sheets in Google Sheets

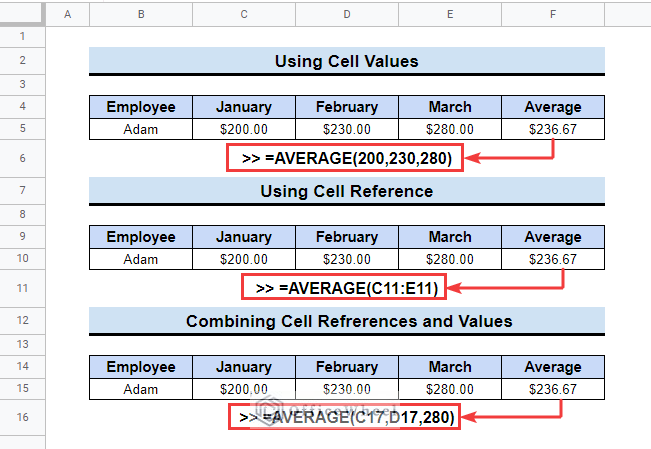
In Google Sheets, calculating the average is the most common and basic function. We use this equation most often for different purposes. So, in this ...

How to Insert Moving Average Trendline in Google Sheets

In order to see the current trend of any business parameter, moving average trendlines are crucial. It identifies the current trend direction and ...

How to Find Correlation Coefficient in Google Sheets

A correlation coefficient is a metric that expresses a correlation, or a statistical link between two variables, in numerical terms. In brief, ...

How to Calculate Standard Deviation in Google Sheets

While working on a dataset maintaining unusual numbers or unnecessary values is very important. As these values make an impact on the dataset. ...

How to Calculate Simple Moving Average in Google Sheets

The Simple Moving Average (SMA) is a statistical operation that we can use to understand the market trend and in market forecasting. It is very ...

How to Find Mean, Median and Mode in Google Sheets

While working on a dataset, sometimes we need some specific data from the dataset. For example, while counting any number in google sheets we need to ...

How to Ignore Blank Cells with AVERAGE Formula in Google Sheets

We average our data often in Google Sheets. However, when we average our data, we may find blank cells. While averaging our data, we may want to omit ...

How to Concatenate Text and Formula in Google Sheets (7 Ways)

We are aware of concatenating 2 corresponding cells in Google Sheets. But to concatenate text and formula is pretty straightforward. For this ...

How to Use Aggregation Functions in Google Sheets (5 Examples)

We use aggregate functions to summarize a large amount of data. There are some functions in Google Sheets that we can use to make an aggregation of ...

How to Add Average Line in Google Sheets (With Detailed Steps)

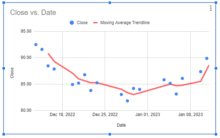
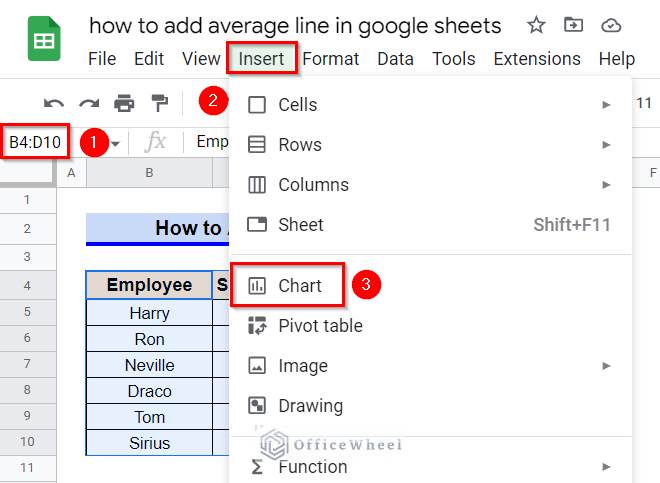
We often create Charts in Google Sheets for better visualization of our data. An average line in our charts can make our visualization much better in ...

OfficeWheel
Logo