Standard deviation is a famous statistical tool in Google Sheets that we use often to measure the spread of values from the actual average values. We can use the built-in STDEV function to calculate the standard deviation in Google Sheets. But sometimes you may want to put some conditions during the calculation of the standard deviation. We can do it by combining the logical IF function with the STDEV function. So, in this article, we’ll see 2 quick ways to calculate standard deviation IF in Google Sheets with clear images and steps. We’ll also see how to find relative standard deviation and standard deviation from graphs in Google Sheets. At last, you’ll get an output like the following image.
A Sample of Practice Spreadsheet
You can download Google Sheets from here and practice very quickly.
What Is Standard Deviation?
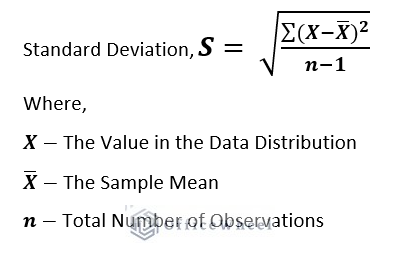
Standard deviation is a statistical tool that calculates the average distance of each value from the average of the whole dataset. In the following picture, you can find the basic formula of standard deviation with the meaning of each value in the formula.
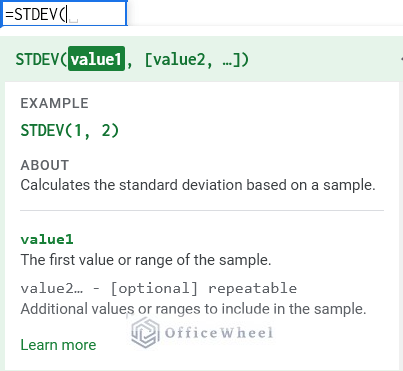
You can easily find the standard deviation of some values in Google Sheets by using the STDEV function. This function is a built-in function in Google Sheets. The syntax of the STDEV function is given below:
STDEV(value1, [value2, ….])- value1 – The first value of the dataset.
- value2 – Additional values of the dataset [ Optional ]
A Practical Example to Calculate Standard Deviation in Google Sheets
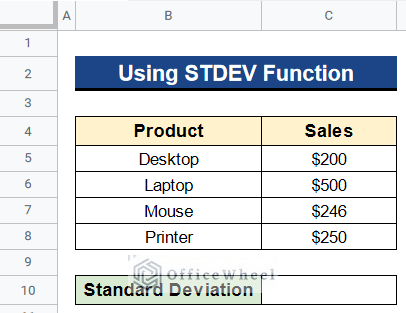
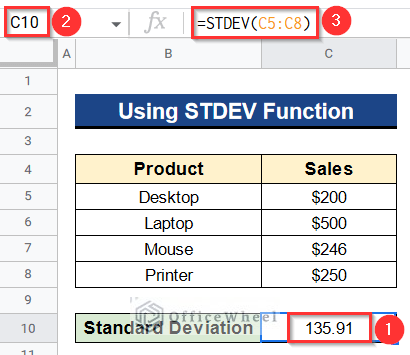
We have the following dataset that has some products in Column B and their sales prices in Column C. Now, we’ll determine the standard deviation of the sales prices by using the STDEV function. Let’s see the steps.
Steps:
- Firstly, type the following formula in Cell C10–
=STDEV(C5:C8)- Secondly, hit Enter to get the standard deviation of the sales price.
Read More: How to Add Different Standard Deviation Bars in Google Sheets
2 Quick Ways to Calculate Standard Deviation with IF Condition in Google Sheets
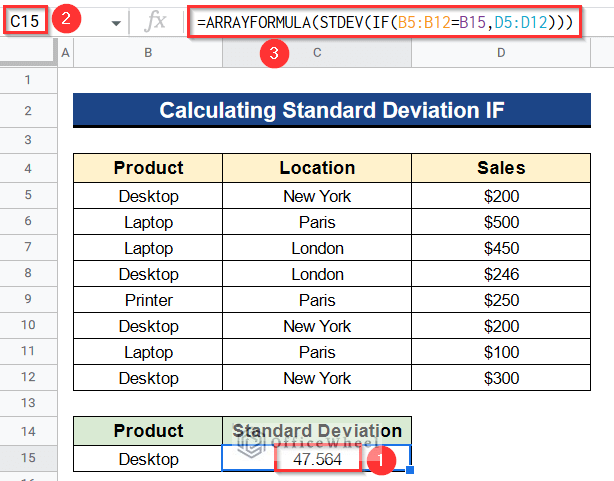
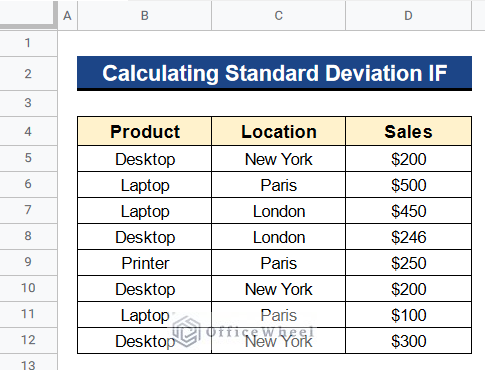
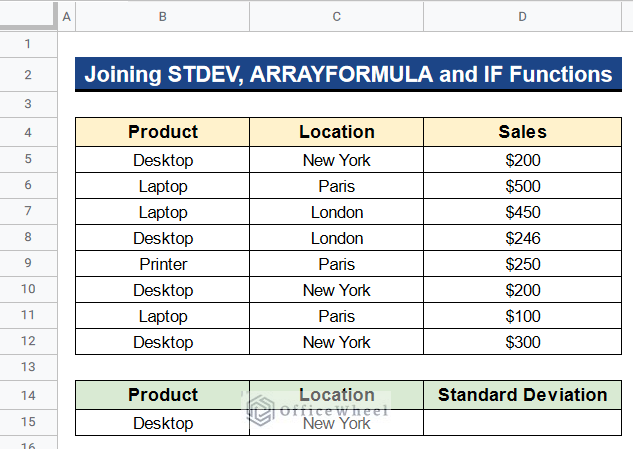
Let’s get introduced to our dataset first. Here we have some products in Column B, their selling location in Column C, and their sales prices in Column D. If you look closely you’ll find that some products and locations are multiple in numbers. And we don’t want the standard deviation of the sales prices of all products. We just want to determine the standard deviation of some products or locations. So we have to combine the STDEV function with the logical function IF. Now we’ll use the IF function with the STDEV function to determine the standard deviation based on products or location or both. Below I’ll show you 2 quick ways to calculate standard deviation IF in Google Sheets by using this dataset.
1. Joining STDEV, ARRAYFORMULA and IF Functions
First of all, we’ll join the STDEV, ARRAYFORMULA, and IF functions to calculate the standard deviation based on products or location or both. I’ll show 2 criteria below to determine the standard deviation, single criteria, and multiple criteria. The logical function IF serves the purpose to put some conditions and then the STDEV function determines the standard deviation based on that criteria. The ARRAYFORMULA function lastly expands the results over the whole dataset.
1.1 For Single Criteria
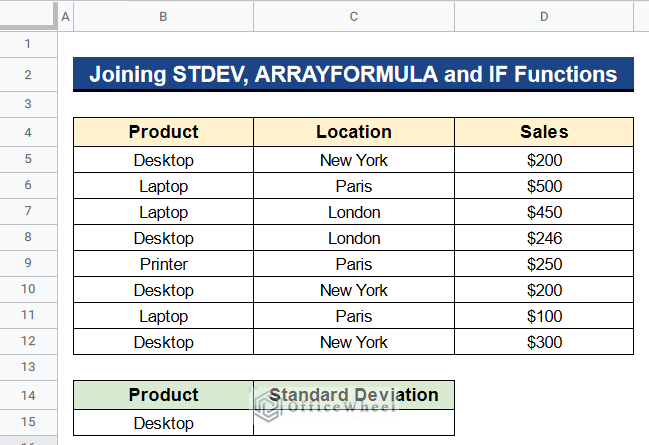
First, we’ll see the process for single criteria. There are several products in our dataset. We now determine the standard deviation for only the product Desktop. So, we’ll insert the logical IF function inside the STDEV function. Then we’ll expand the formula to the whole dataset by the ARRAYFORMULA function. Let’s see the steps below.
Steps:
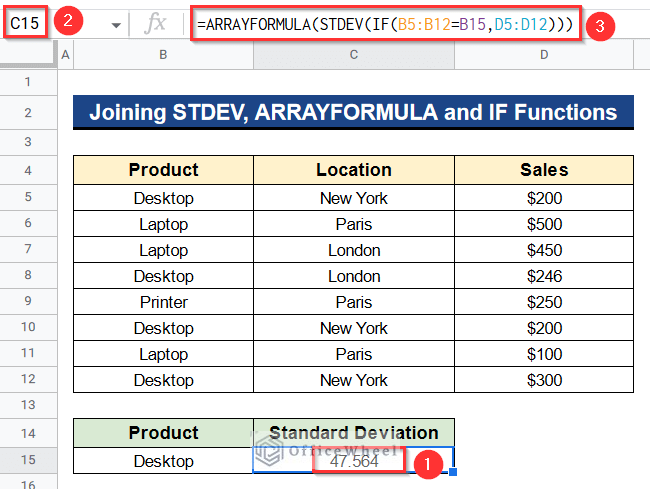
- At first, insert the following formula in Cell C15–
=ARRAYFORMULA(STDEV(IF(B5:B12=B15,D5:D12)))- Then, press Enter to get the standard deviation of the sales price of Desktop.
Formula Breakdown
- IF(B5:B12=B15,D5:D12)
Firstly, this function searches for the product Desktop in Cells B5 to B12 and returns corresponding sales prices from Cells D5 to D12.
- STDEV(IF(B5:B12=B15,D5:D12))
Then, this function calculates the standard deviation of the sales prices of the Desktop which it gets from the IF function.
- ARRAYFORMULA(STDEV(IF(B5:B12=B15,D5:D12)))
Finally, this function turns the above formulas into an array and expands the calculation to the whole dataset to give the output quickly.
1.2 For Multiple Criteria
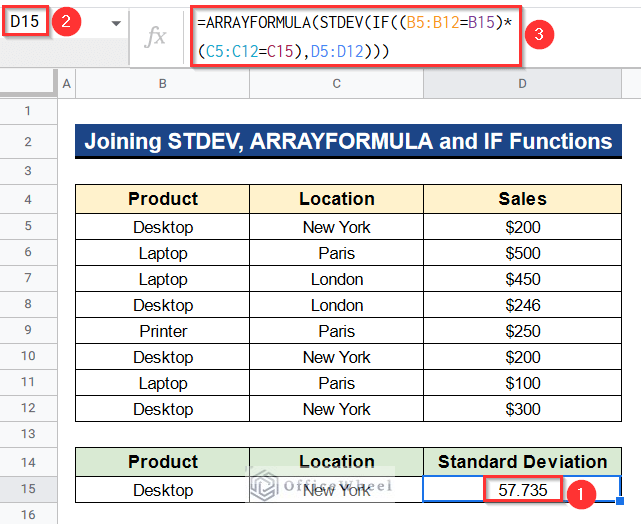
Now, we’ll see the process for multiple criteria. We now determine the standard deviation for only the products Desktop those locations are in New York. So, we’ll use the AND operator (*) to connect these 2 criteria inside the logical IF function. Then, the STDEV function will determine the standard deviation based on the above criteria. After that, by using the ARRAYFORMULA function, we will extend the formula to the entire dataset.
Steps:
- First of all, activate Cell D15.
- Then, type the following formula in it-
=ARRAYFORMULA(STDEV(IF((B5:B12=B15)* (C5:C12=C15),D5:D12)))- Next, click Enter to obtain the standard deviation of the sales price of Desktop whose location is New York.
Formula Breakdown
- IF((B5:B12=B15)* (C5:C12=C15),D5:D12)
Firstly, this function searches both for the product Desktop in Cells B5 to B12 and location New York in Cells C5 to C12 with the help of the AND operator (*). Then it returns corresponding sales prices from Cells D5 to D12.
- STDEV(IF((B5:B12=B15)* (C5:C12=C15),D5:D12))
Next, this function uses information from the IF function to calculate the standard deviation of the sales prices for Desktop and New York combined.
- ARRAYFORMULA(STDEV(IF((B5:B12=B15)* (C5:C12=C15),D5:D12)))
To quickly produce the output, this function expands the calculation to include the entire dataset by converting the aforementioned formulas into an array.
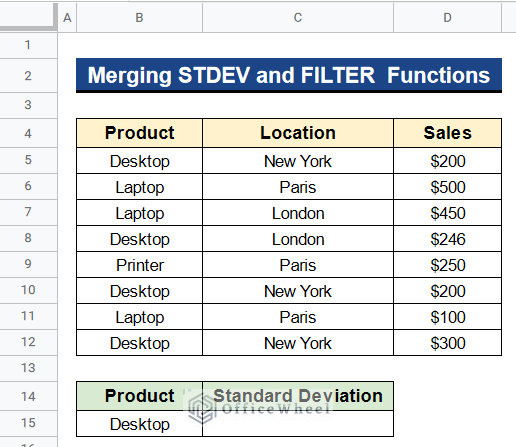
2. Merging STDEV and FILTER Functions
Apart from the previous method, we can merge the STDEV and FILTER functions to determine the standard deviation for only the product Desktop. The FILTER function filters out the sales prices of the product Desktop and then the STDEV function calculates the standard deviation directly. The advantage of this method is that we don’t have to use the ARRAYFORMULA function here. The FILTER function is capable to work with the whole dataset.
Steps:
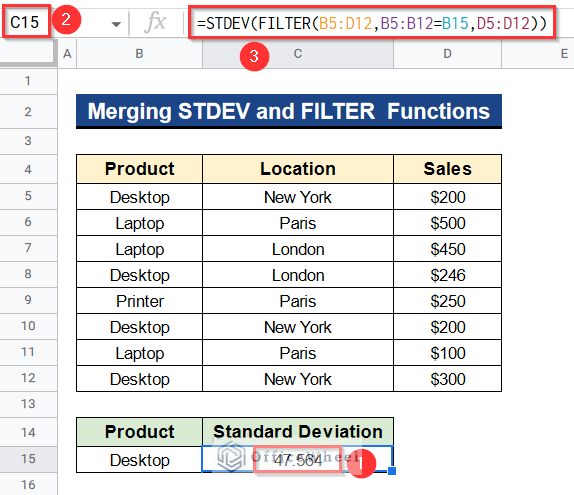
- In the first place, select Cell C15 and put the formula there-
=STDEV(FILTER(B5:D12,B5:B12=B15,D5:D12))- Next, press Enter to get the Desktop sales price’s standard deviation.
Formula Breakdown
- FILTER(B5:D12,B5:B12=B15,D5:D12)
Firstly, this function filters out the sales prices from Cells D5 to D12 with respect to the product Desktop it finds in Cells B5 to B12.
- STDEV(FILTER(B5:D12,B5:B12=B15,D5:D12))
Finally, this function calculates the standard deviation of the sales prices of the Desktop.
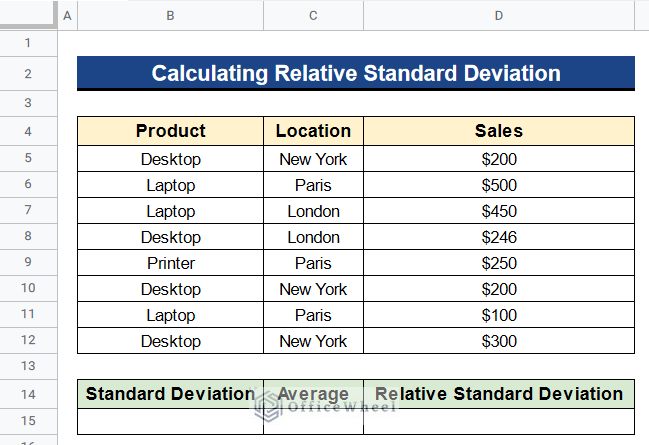
How to Calculate Relative Standard Deviation in Google Sheets
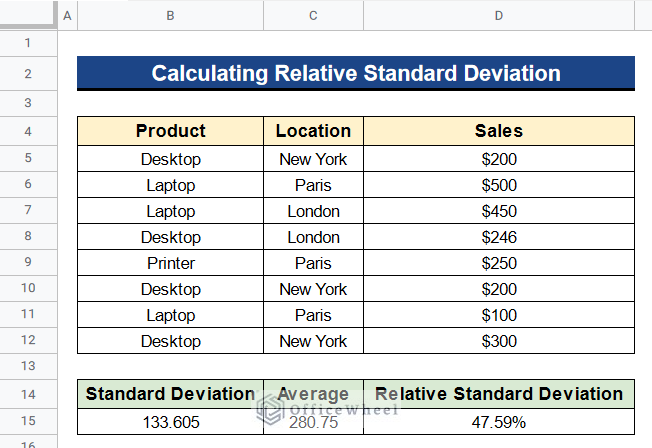
The ratio of the standard deviation to the mean for a collection of numbers is known as the relative standard deviation. This relative standard deviation is shown in a percentage format. We can calculate the relative standard deviation in Google Sheets by using several functions. Like in the below dataset, we’ll find the relative standard deviation of all the sales prices. So, first, we have to determine the standard deviation by the STDEV function. Then we’ll find the mean of the dataset by the AVERAGE function. At last, when we divide the standard deviation with this mean and format it in percentage format, our desired relative standard deviation will be shown.
Steps:
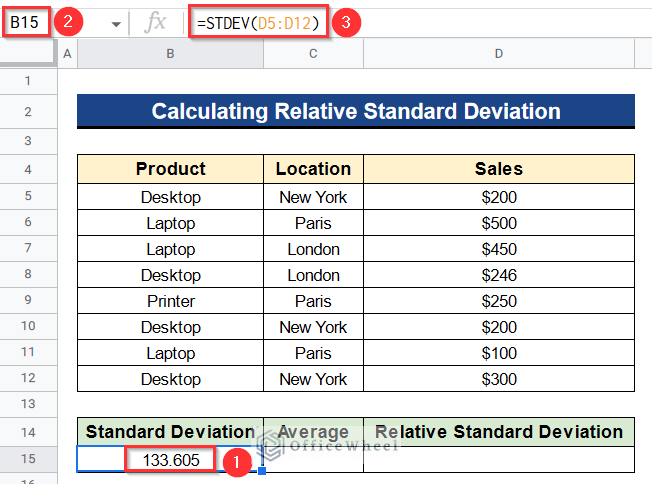
- In the beginning, select Cell B15.
- Then, write the below formula there-
=STDEV(D5:D12)- Next, press Enter to get the standard deviation of all the sales prices of all products.
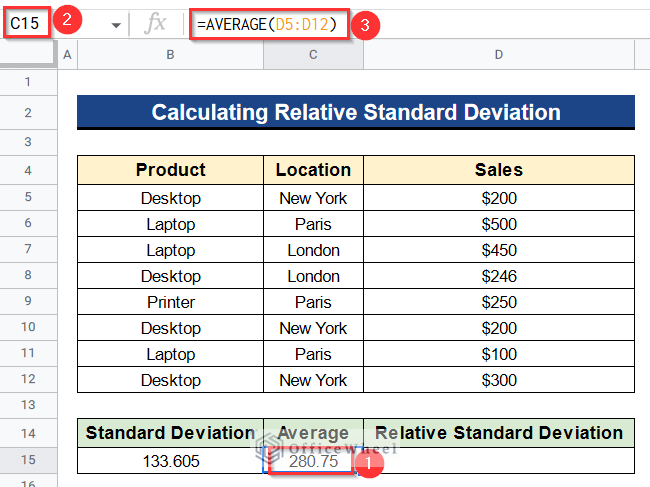
- Again, type the following formula in Cell C15 to determine the average of all the sales prices-
=AVERAGE(D5:D12)- Also, hit Enter to get the average.
- Now, put the custom formula in Cell D15 to divide the standard deviation with the average and press Enter button-
=B15/C15- We have to change the format of Cell D15 to percentage to obtain the relative standard deviation.
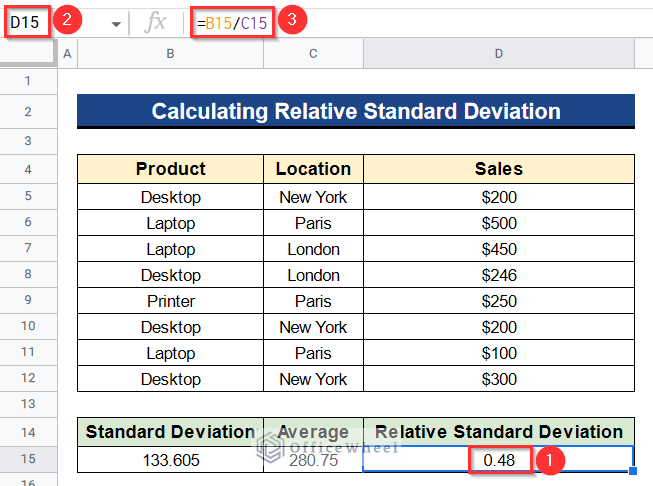
- So, select Cell D15 and go to Format > Number > Percent.
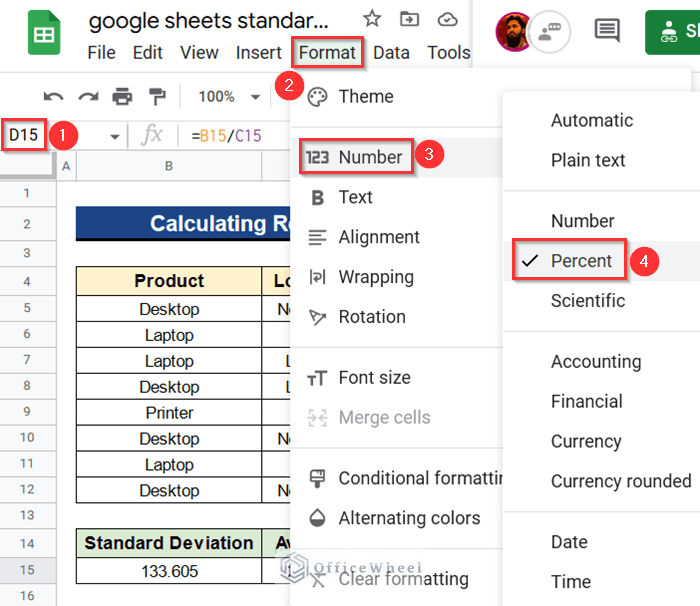
- Finally, you’ll get the relative standard deviation in the percentage format.
Read More: Calculate Standard Deviation of Weighted Variables in Google Sheets
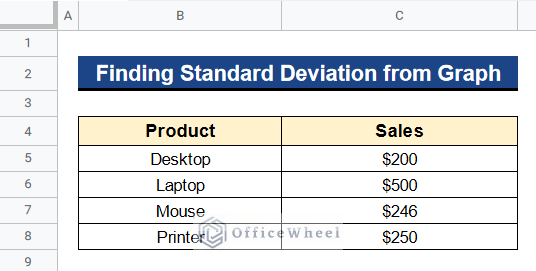
How to Find Standard Deviation from Google Sheets Graph
We can also find the standard deviation bars from Google Sheets graph. This feature is only applicable to the Column Chart type. We can easily plot a Column Chart from our dataset and then plot the standard deviation bars in the chart. The combined series standard deviation, not the standard deviation for individual series, may therefore be calculated from these bars. The process is given below.
Steps:
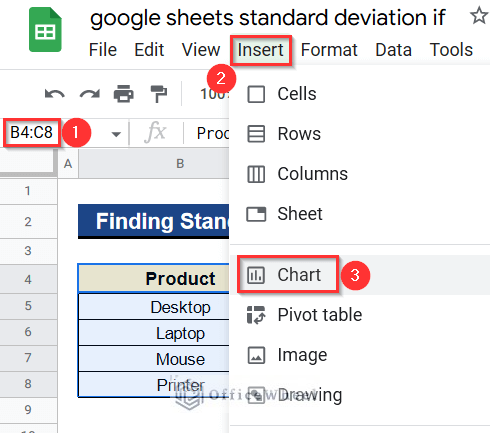
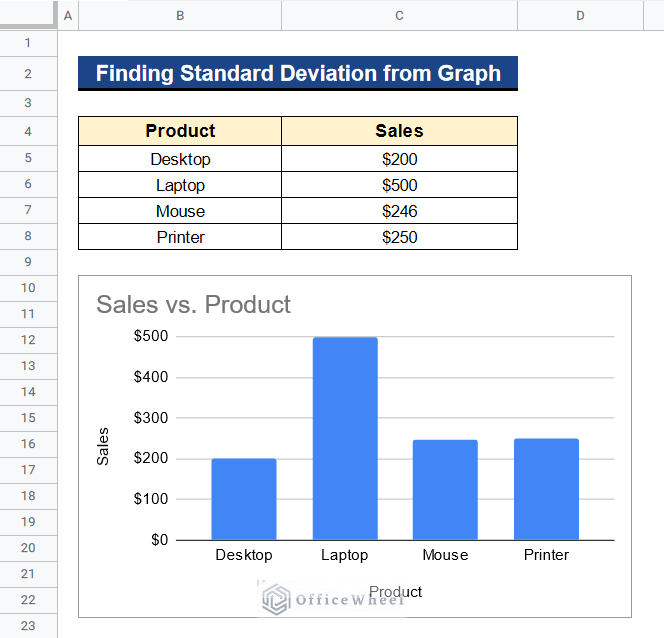
- Before all, select all the cells from Cell B4 to C8 and go to Insert > Chart.
- The Chart Editor window will open.
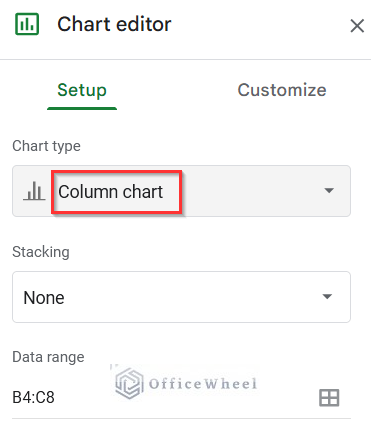
- Then, select Column Chart in the Chart Type menu under this window.
- We are using a Column Chart here because we are going to add standard deviation bars which are only possible under this Chart Type.
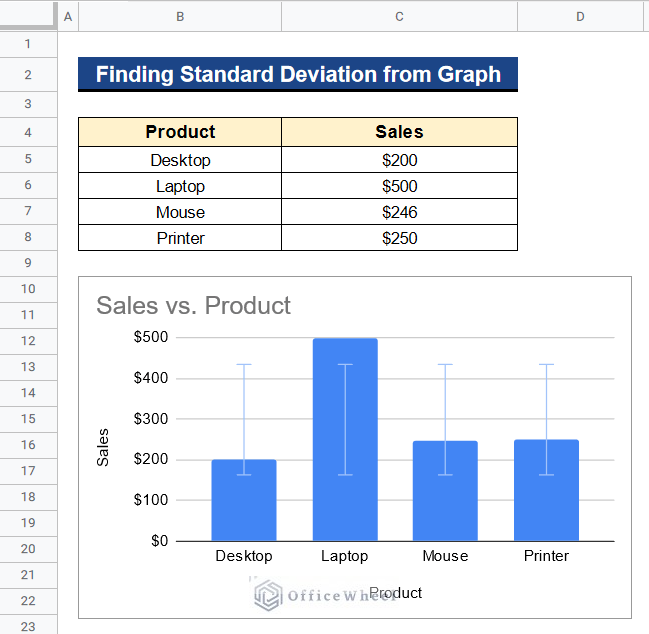
- Next, you’ll see a Column Chart is ready titled Sales vs. Product.
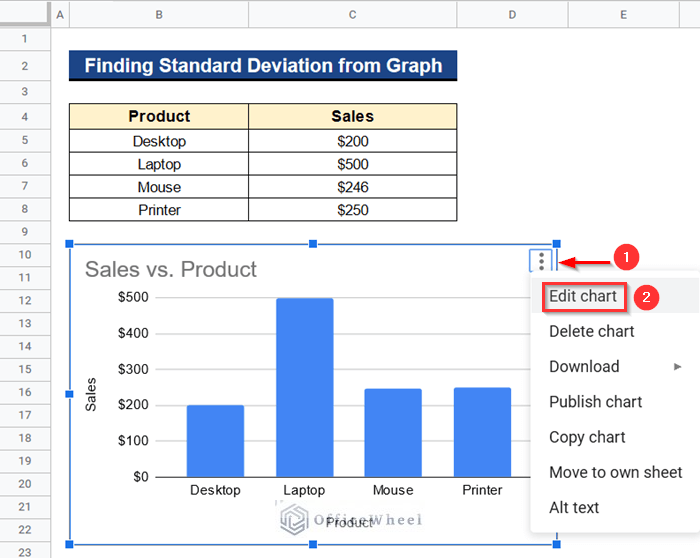
- After that, click on the 3 Dot menu icon in the corner of the chart and select Edit Chart to open the Chart Editor window again.
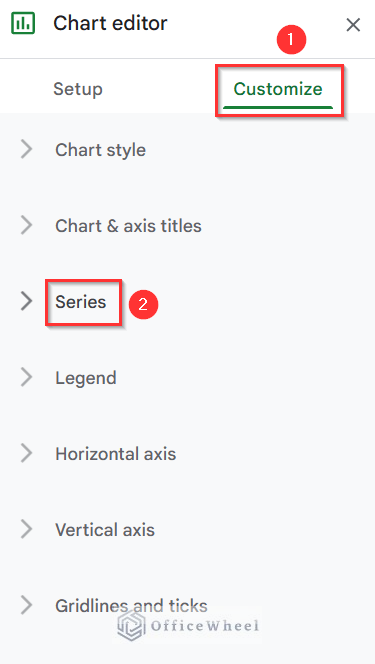
- In the Chart Editor window, go to the Series menu under Customize tab.
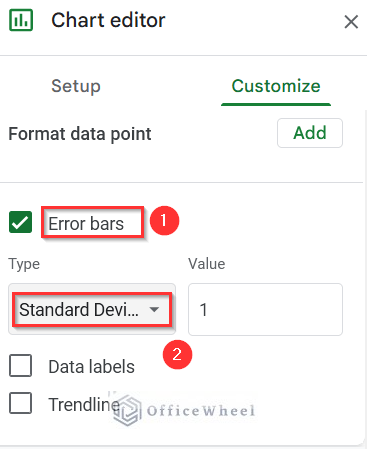
- Check the box for Error Bars at the bottom of the Series menu.
- Select Standard Deviation from the Type menu after that.
- The Value parameter should then remain at 1 to display error bars that are one standard deviation from the mean of all series.
- Finally, your graph will show standard deviation bars.
- Now, we’ll format this chart to increase the visibility of the standard deviation bars.
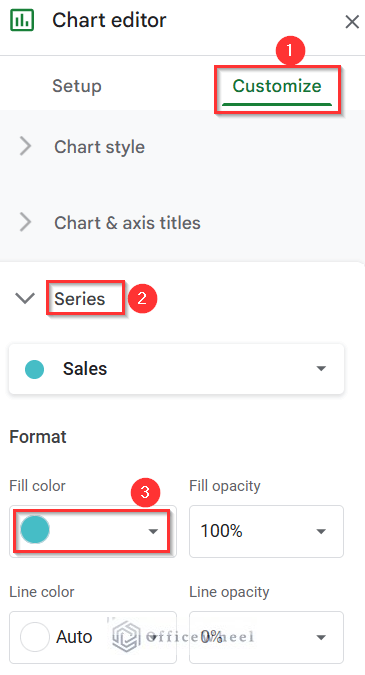
- So, once more navigate to the Series menu under the Customize tab in the Chart Editor window.
- Then, select a suitable color under the Format menu in the color box. We choose light green.
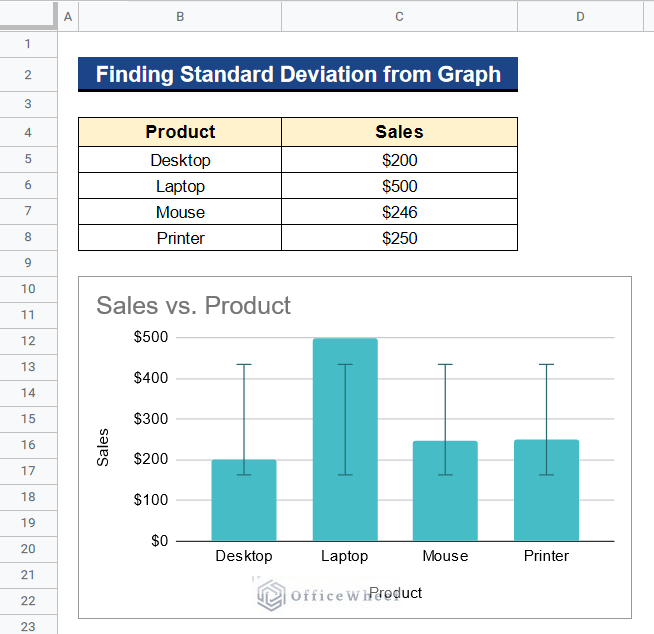
- Ultimately, your graph is ready with the standard deviation bars.
- Keep in mind that these bars show the combined series standard deviation, not the standard deviation for each series.
Other Functions to Calculate Standard Deviation in Google Sheets
There are other standard deviation functions in Google Sheets that you can use to calculate standard deviation in different conditions. They are-
- STDEVP: This function determines the standard deviation using data from the entire population.
- STDEVA: The text value is set to 0 by this function and then it calculates the standard deviation using sample data.
- STDEVPA: This function calculates the standard deviation using data from the complete population and setting the text value to 0.
Conclusion
That’s all for now. Thank you for reading this article. In this article, I have discussed 2 quick ways to calculate standard deviation IF in Google Sheets. I have also discussed how to find relative standard deviation and standard deviation from graphs in Google Sheets. Please comment in the comment section if you have any queries about this article. You will also find different articles related to google sheets on our officewheel.com. Visit the site and explore more.