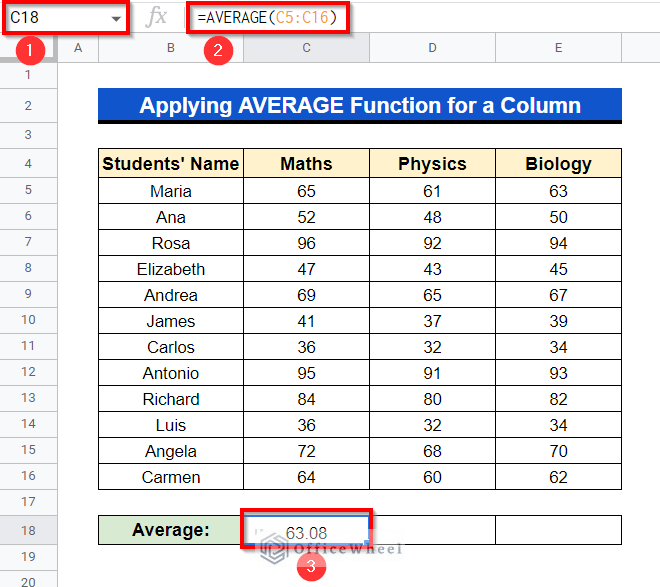
We use aggregate functions to summarize a large amount of data. There are some functions in Google Sheets that we can use to make an aggregation of ...
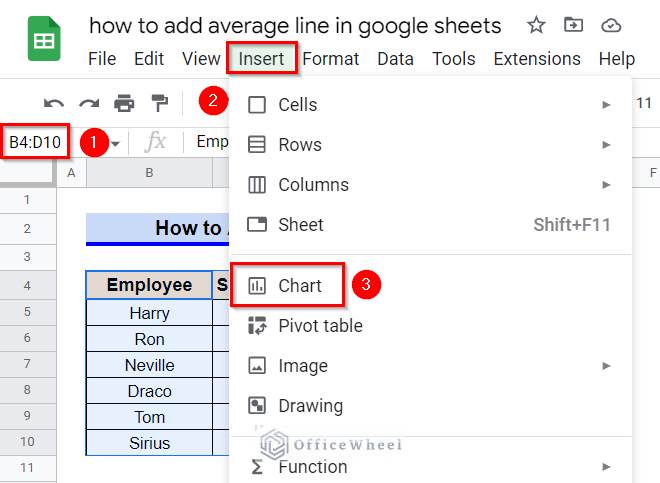
We often create Charts in Google Sheets for better visualization of our data. An average line in our charts can make our visualization much better in ...
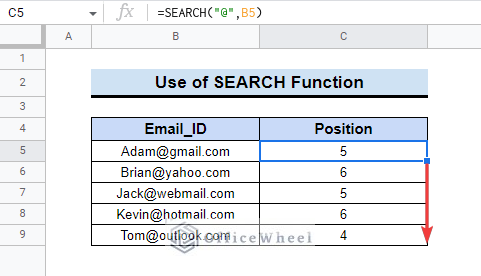
Most of the functions in Google Sheets are designed for vertically arranged data. But horizontally arranged data needs horizontal data retrieving. In ...
You may quickly provide your visitors with a chance to click a link and visit a website that is pertinent to your content by adding links to the text ...
We often Copy and Paste values from one cell to another in Google Sheets. One might even copy values from other files like Google Docs, MS Excel, MS ...
The standard error of the mean is a great tool for statistical data analysis. It simply tells us how far or near is our sample data to the real data ...
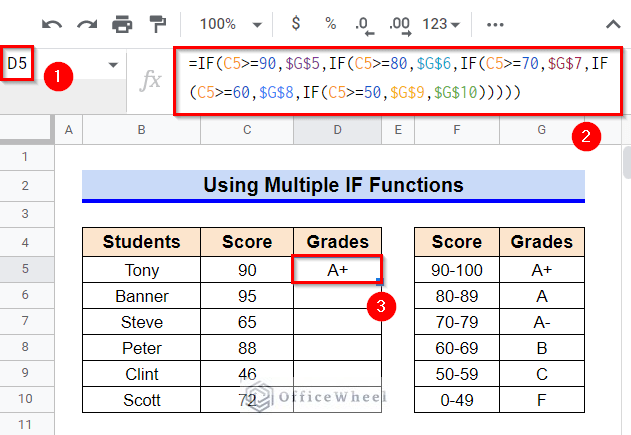
The IFS function returns logical values quickly for multiple criteria in Google Sheets. Whereas this function has a certain limitation. It can only ...
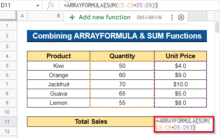
Every cell in your specified data range is applied with a single formula via the ARRAYFORMULA function in Google Sheets. By converting your formula ...


![[Solved!] Paste Values Is Not Working in Google Sheets (2 Fixes)](https://officewheel.com/wp-content/uploads/2022/12/paste-values-not-working-in-google-sheets-5.png?v=1698049995)


![[Fixed!] IFS Function Is Returning No Match Error in Google Sheets](https://officewheel.com/wp-content/uploads/2022/12/google-sheets-ifs-no-match-4.png?v=1698049850)