The standard error of the mean is a great tool for statistical data analysis. It simply tells us how far or near is our sample data to the real data which is called population. Then we can mathematically determine the validity of our sample data. In this article, we’ll see 2 suitable examples to determine the standard error of the mean in Google Sheets with clear images and steps.
A Sample of Practice Spreadsheet
You can download Google Sheets from here and practice very quickly.
What Is Standard Error of Mean?
The standard error of the mean is a parameter in statistics that measures how the sample values in a dataset are scattered from the actual mean of the real data. The mathematical formula to calculate this is-
- Standard Error of the Mean = s/√n
Here,
s is the standard deviation of the sample dataset and n is the total number of values in the sample.
Let’s see an example. Suppose we want to know the food habit of the people of London. Obviously, we’ll do several surveys. But different samples of data will give you different outputs. After that when we take the mean from a sample and compare it with the actual population of London. Then the standard error of the mean will tell us how relatable our sample is with the actual population.
2 Suitable Examples to Determine Standard Error of Mean in Google Sheets
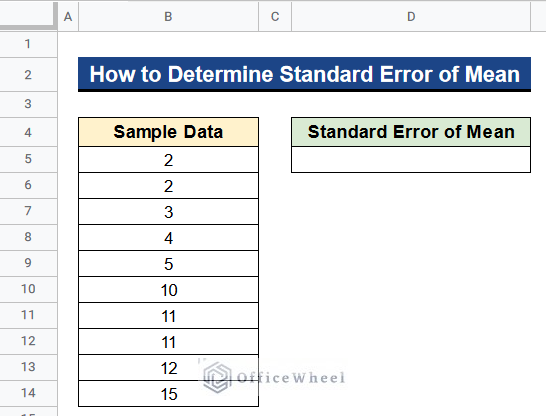
Let’s get introduced to our dataset first. Here we have sample data of 10 samples in Column B. Now I’ll show you 2 suitable examples to determine the standard error of the mean in Google Sheets with the help of this dataset.
Example 1. Combining STDEV, SQRT and COUNT Functions
Firstly, we can combine the STDEV, SQRT and COUNT functions to calculate the standard error of the mean in Google Sheets. Merging these 3 functions will produce the result very quickly.
Steps:
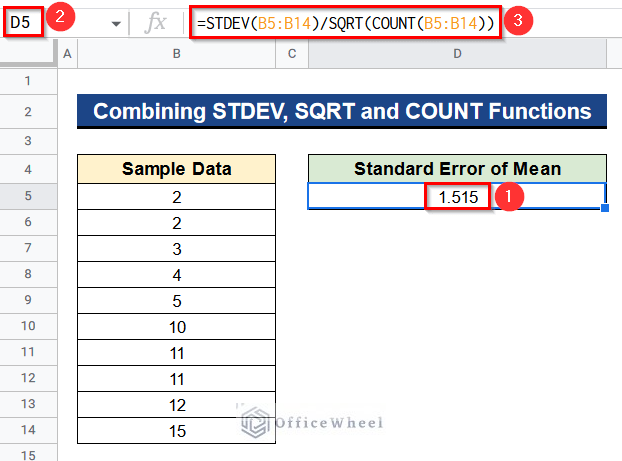
- First of all, type the following formula in Cell D5–
=STDEV(B5:B14)/SQRT(COUNT(B5:B14))- Then, hit Enter to get the standard error of the mean.
Formula Breakdown
- STDEV(B5:B14)
Initially, this function calculates the standard deviation of the values from Cell B5 to B14.
- COUNT(B5:B14)
Consequently, this function counts the number of values present from Cell B5 to B14.
- SQRT(COUNT(B5:B14))
Moreover, this formula determines the square root of the value we get from the COUNT function.
- STDEV(B5:B14)/SQRT(COUNT(B5:B14))
Ultimately, these 3 functions together calculate the standard error of the mean of the values from Cell B5 to B14.
Read More: How to Find Mean, Median and Mode in Google Sheets
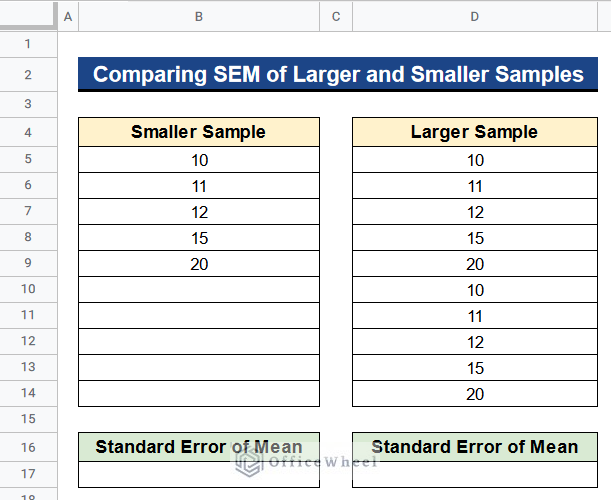
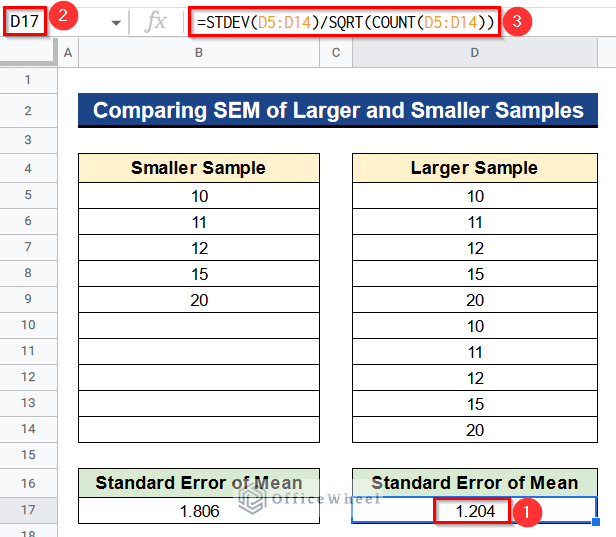
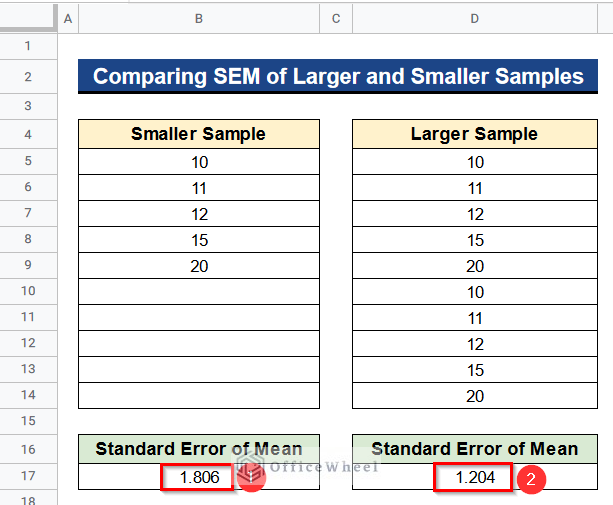
Example 2. Comparing Standard Error of Mean of Larger and Smaller Samples
Last but not least, we can compare the standard error of the mean of larger and smaller samples. As the sample size increases the standard error of the mean decreases. It means that as we take more samples, the output becomes more reliable. Let’s see the steps.
Steps:
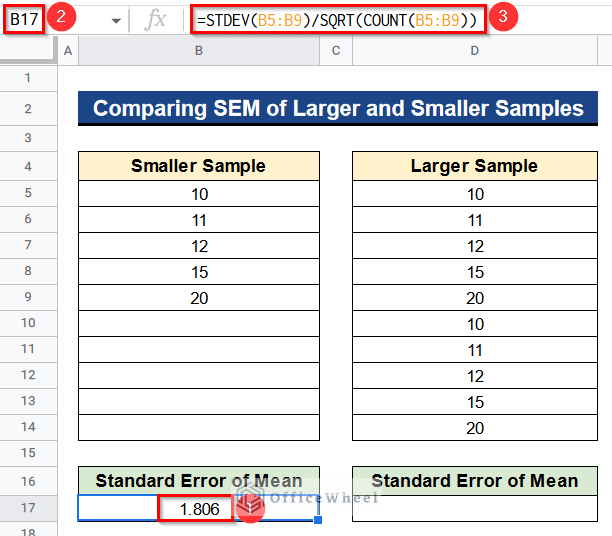
- In the beginning, write the following formula in Cell B17–
=STDEV(B5:B9)/SQRT(COUNT(B5:B9))- Next, press Enter to get the desired standard error of the mean for smaller samples.
- After that, insert the following formula in Cell D17–
=STDEV(D5:D14)/SQRT(COUNT(D5:D14))- Again, click Enter to get the desired result for larger samples.
Formula Breakdown
- First of all, the STDEV function calculates the standard deviation of the given range of data.
- Then, the COUNT function will count the number of values present in the range.
- After that, the SQRT function will calculate the square root of the value we get from the COUNT function.
- Lastly, dividing the output of the STDEV function by the output of the SQRT function as you see earlier will give the standard error of the mean of any range of data.
- Finally, you’ll see that the standard error of the mean for smaller samples is 1.806 and for the larger samples is 1.204. So when the sample is greater the standard error of the mean is smaller. So larger data will give us a more reliable output.
Importance of Calculating Standard Error of Mean
- You can determine the accuracy of your sample data with the actual population.
- You’ll find the applicability of your survey findings in the actual scenario.
- You could tell the difference between your sample data with the actual values.
- If your standard error of the mean is large then your findings have low accuracy and vice versa.
Conclusion
That’s all for now. Thank you for reading this article. In this article, I have discussed 2 suitable examples to determine the standard error of the mean in Google Sheets. Please comment in the comment section if you have any queries about this article. You will also find different articles related to google sheets on our officewheel.com. Visit the site and explore more.