Printing is a useful way of showing a document and a medium for sharing it with people. Printing in landscape mode allows you to print the worksheet ...
Named range can be a useful feature in Google Sheets if you are working with a large volume of data. It can help you memorize important parts of your ...
The 50 day moving average is a useful tool for identifying trends in data. It is calculated by taking the average of a security's price over the past ...
In Google Sheets, the INDEX MATCH function is the combination of two basic functions: INDEX and MATCH function. Though separately these two functions ...
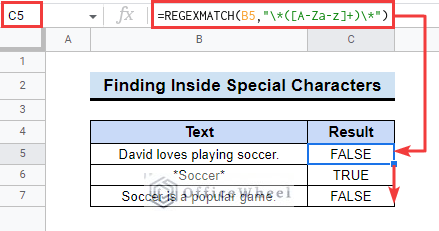
While working on google sheets sometimes you need to extract some particular characters, Capital letters, decimal numbers, and so on. But Getting all ...
Wildcards are a set of special symbols that help you for an effective search result and can represent a group of similar strings at a time. In this ...
While working on a dataset, sometimes we need some specific data from the dataset. For example, while counting any number in google sheets we need to ...