Linear regression is a great method to perform some statistical analysis and predict future values. You can perform linear regression in Google Sheets by using some built-in functions like the LINEST function. To determine the linear regression, you may also use the built-in charts in Google Sheets. In this article, we’ll see 3 useful methods on how to find linear regression in Google Sheets with clear steps and images.
A Sample of Practice Spreadsheet
You can download Google Sheets from here and practice very quickly.
What Is Linear Regression in Google Sheets?
A technique for calculating the relationship between one or more independent variables and one or more dependent variables is called linear regression.
Let’s say you want to sell a product and are curious about its market value. You have data on the product, which serves as an independent variable and you also have data on the selling price, which serves as a dependent variable. Now, you can use the past data values to predict the future by linear regression. It generates an equation that forecasts future values.
3 Useful Methods to Find Linear Regression in Google Sheets
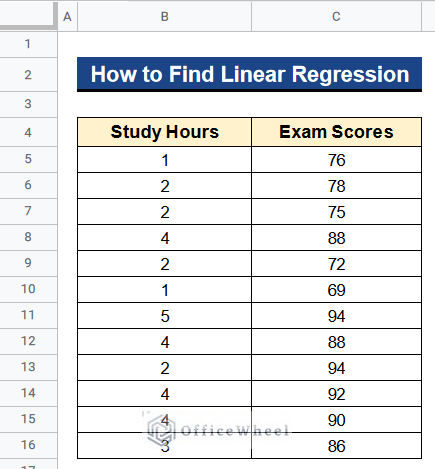
Let’s get introduced to our dataset first. Here we have the study hours of some students in Column B and their exam scores in Column C. Now we want to know the relationship between these 2 values. So we’ll perform linear regression using these 2 values where we’ll put the scores as dependent variables and the study hours as independent variables. Below I’ll show you 3 useful methods on how to find linear regression in Google Sheets with the help of this dataset.
1. Using LINEST Function
First and foremost, we can use the LINEST function to perform the linear regression analysis. This function directly gives results with just a single click. By using this function we can perform simple linear regression where there is only one dependent and one independent variable. And also we can do multiple linear regression where there are 2 independent variables but only one dependent variable. Let’s see both methods.
1.1 Simple Linear Regression
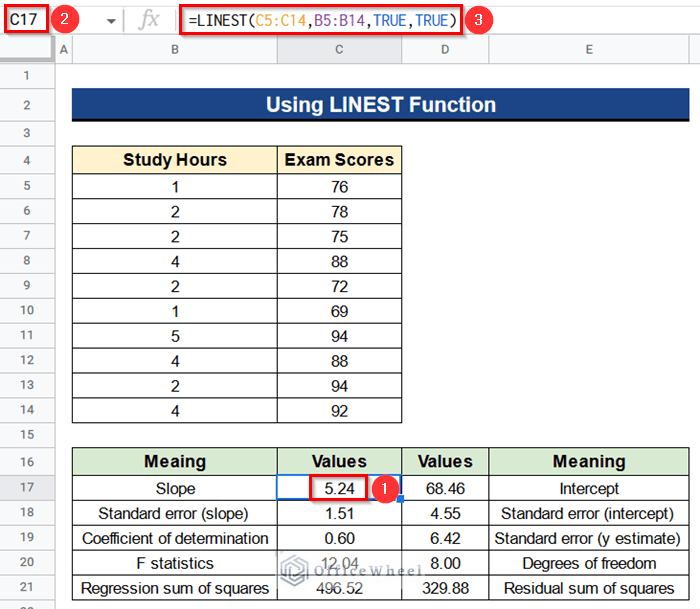
We’ll do simple linear regression first. Here we treat scores as dependent variables and study hours as independent variables. After the analysis, we’ll get the values for Slope, Standard error (slope), Coefficient of determination, F statistics, Regression sum of squares, Intercept, Standard error (intercept), Standard error (y estimate), Degrees of freedom, and Residual sum of squares. Let’s see the steps.
Steps:
- Firstly, type the following formula in Cell C17–
=LINEST(C5:C14,B5:B14,TRUE,TRUE)- Secondly, press Enter to perform simple linear regression.
Formula Breakdown
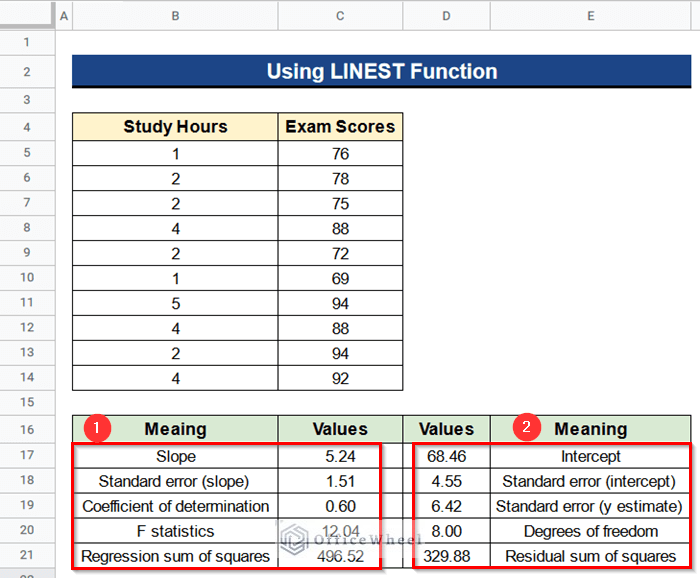
- Foremost, we have to give the dependent variables which are the exam scores. So we put the range from Cell C5 to C14.
- Then, we give the range from Cell B5 to B14 as the independent variables.
- After that, we give TRUE to calculate the y-intercept.
- Lastly, we put TRUE to obtain the additional regression statistical values.
Read More: How to Find Correlation Coefficient in Google Sheets
1.2 Multiple Linear Regression
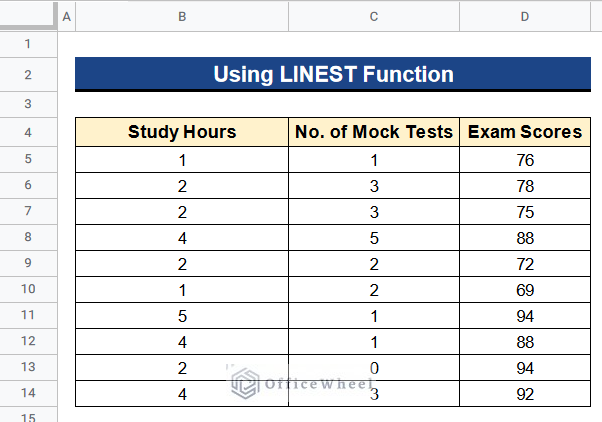
Now, we’ll perform multiple linear regression. So I have made some changes to our dataset. I add no. of mock tests in Column C. I’ll treat study hours and no. of mock tests both as independent variables and scores as dependent variables. Let’s see the steps below regarding multiple linear regression.
Steps:
- At first, select Cell C17.
- Then, insert the following formula there-
=LINEST(D5:D14,B5:C14,TRUE,TRUE)- Next, hit Enter to do multiple linear regression.
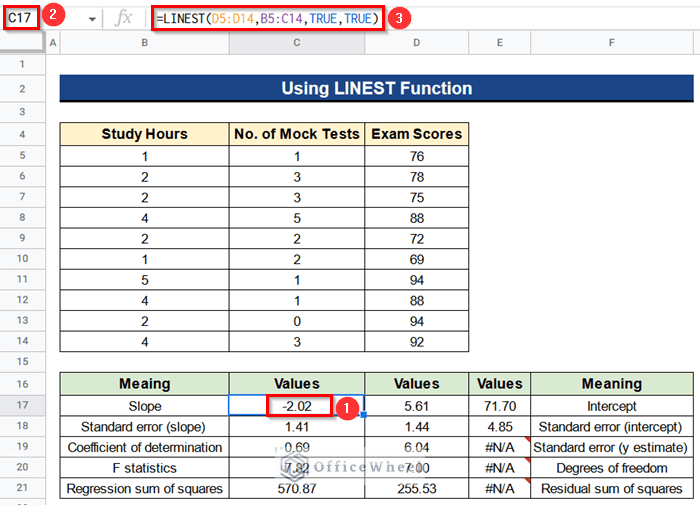
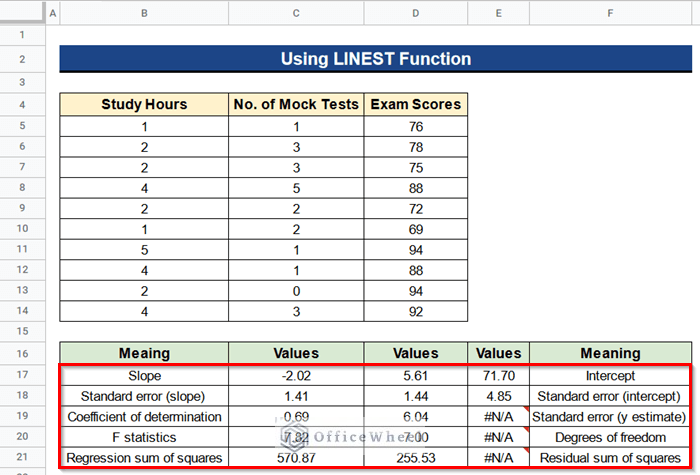
- At last, Columns C, D, and E of your dataset will provide all the statistical results for the multiple linear regression. You’ll also find their meaning in adjacent cells in Columns B and F.
Read More: Easy Guide to Replace Formula with Value in Google Sheets
Similar Readings
- How to Find Trash in Google Sheets (with Quick Steps)
- Find and Replace in Google Sheets (3 Ways)
- How to Find and Delete in Google Sheets (An Easy Guide)
- Find Value in a Range in Google Sheets (3 Easy Ways)
- How to Use the Find Function in Google Sheets (An Easy Guide)
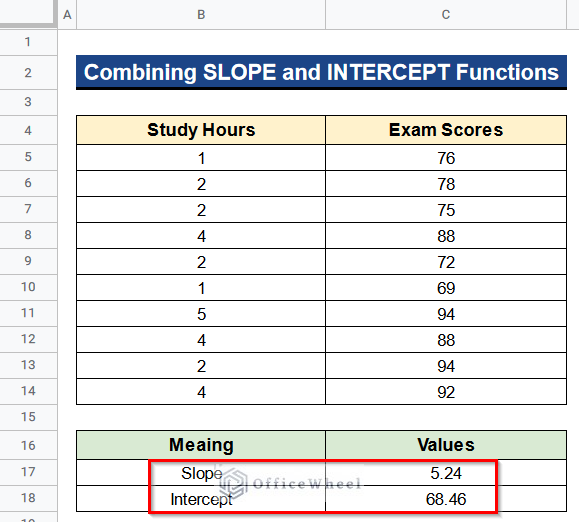
2. Combining SLOPE and INTERCEPT Functions
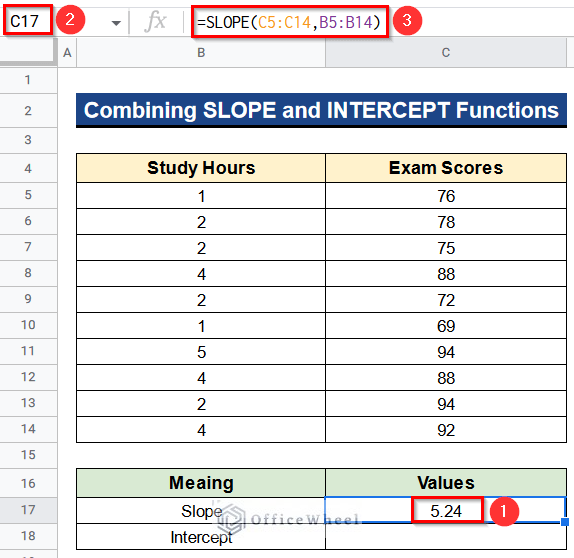
We can also use the SLOPE and INTERCEPT functions to find linear regression in Google Sheets. But the problem is we’ll get only the slope and intercept values if we use these functions. We’ll not get any other statistical values like the previous methods.
Steps:
- First of all, activate Cell C17 and put the following formula in it-
=SLOPE(C5:C14,B5:B14)- Then, click Enter to get the slope value of our dataset.
- Again, write the below formula in Cell C18–
=INTERCEPT(C5:C14,B5:B14)- Next, hit the Enter button to calculate the intercept value.
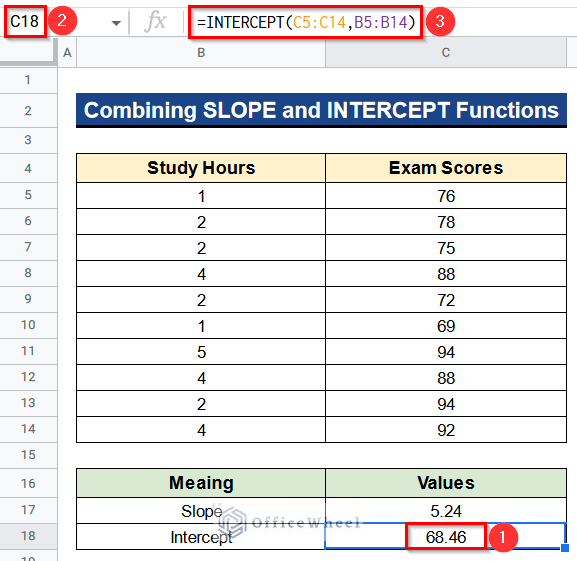
- In the end, you’ll only get the slope and intercept values in Rows 17 and 18.
Read More: How to Find Slope of Graph in Google Sheets (With Easy Steps)
3. Assigning Scatter Chart Command
Apart from the previous methods we can use the Scatter Chart command to make a chart and perform linear regression or forecast future values. In this method, we’ll plot the study hours on the x-axis as independent variables and scores on the y-axis as dependent variables. Then, I’ll get a Trendline out of these values. We can also see the equation of this Trendline and the coefficient of determination of the values. The equation can be further used to forecast data.
Steps:
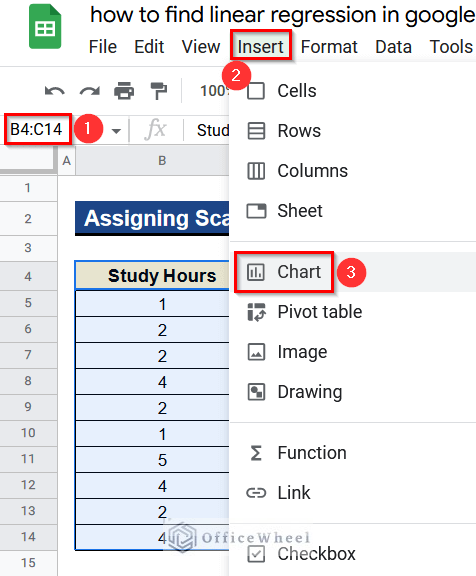
- Before all, select all the cells from Cell B4 to C14 and go to Insert > Chart.
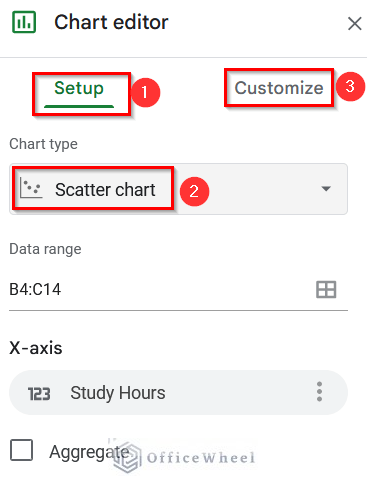
- After that, the Chart Editor window will open.
- From there, click on the Setup menu and choose Scatter Chart under the Chart Type menu.
- Consequently, go to Customize menu.
- Thereafter, go to the Series menu under the Customize menu.
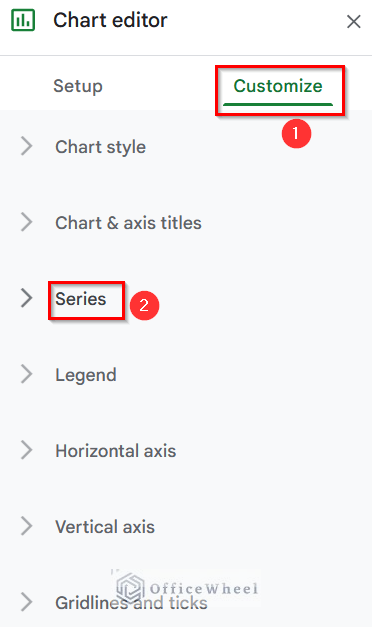
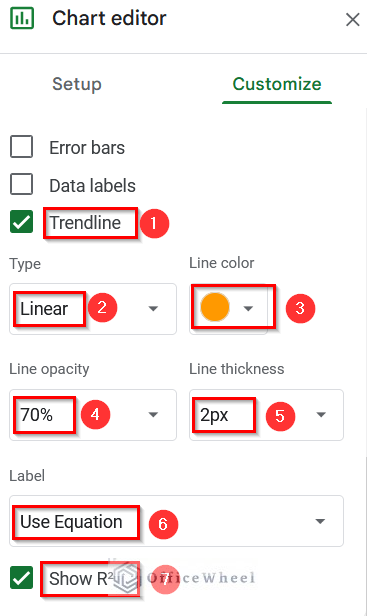
- Moreover, give a tick beside Trendline to get the trendline in our chart.
- Then, choose the chart type as Linear, select the brown color as the line color, and give the line opacity as 70% and line thickness as 2px.
- You can choose these options as your wish.
- Next, pick Use Equation under the Label menu to obtain the equation of the Trendline.
- After that, select the button beside Show R^2. It means the coefficient of determination.
- Further, we’ll see the Scatter Chart is created with the Trendline.
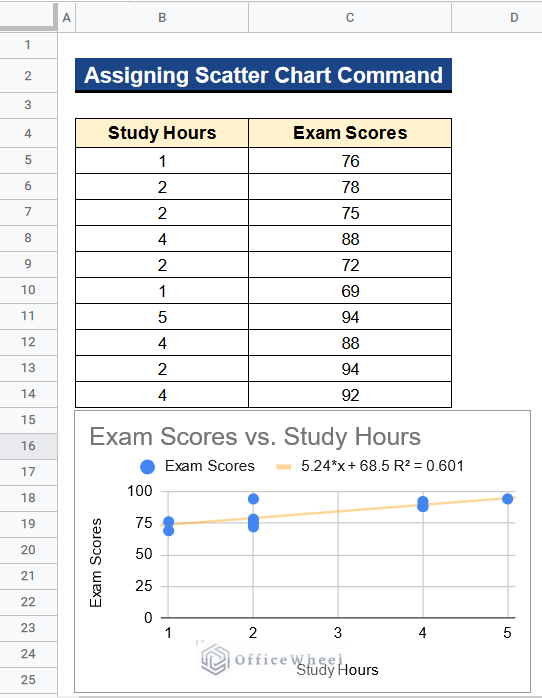
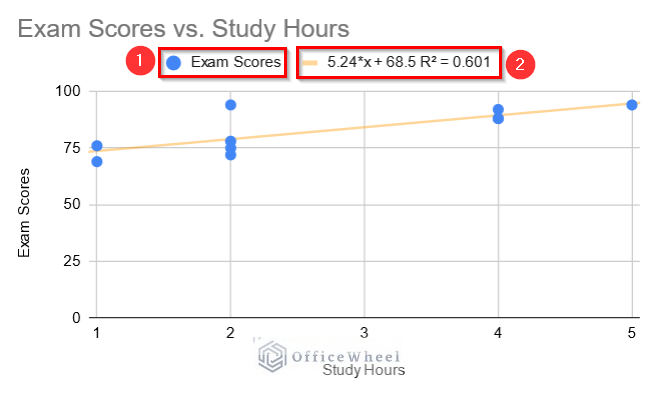
- If you look closely you’ll see that we have plotted Exam Scores against Study hours and got a Trendline regarding this. The blue color dots in the chart denotes the scores. You’ll also find the equation of the Trendline and the value of the coefficient of determination at the top.
Read More: How to Find Slope of Trendline in Google Sheets (4 Simple Ways)
Conclusion
That’s all for now. Thank you for reading this article. In this article, I have discussed 3 useful methods on how to find linear regression in Google Sheets. Please comment in the comment section if you have any queries about this article. You will also find different articles related to google sheets on our officewheel.com. Visit the site and explore more.
Related Articles
- How to Find Hidden Rows in Google Sheets (2 Simple Ways)
- Find P-Value in Google Sheets (With Quick Steps)
- How to Find Median in Google Sheets (2 Easy Ways)
- Find All Cells With Value in Google Sheets (An Easy Guide)
- How to Find Uncertainty of Slope in Google Sheets (3 Quick Steps)
- Find Frequency in Google Sheets (2 Easy Methods)
- How to Use Find and Replace in Column in Google Sheets