From a slope of linear relationship, we can easily calculate the future values. Like, if a car is accelerating from rest at a constant 2 ms-2 we can easily calculate its exact speed at a specific time. But what if the car is accelerating in an inconsistent way? What if there are no similarities between the values of acceleration within a period of time? You can not calculate any exact future values but what you can do is assume them. This is called uncertainty. In this article, we have demonstrated the process to find the uncertainty of slope in Google Sheets. Here’s an overview of the output that we are looking for.

A Sample of Practice Spreadsheet
You can download the spreadsheet used for describing methods in this article from here.
What Is Uncertainty of Slope?
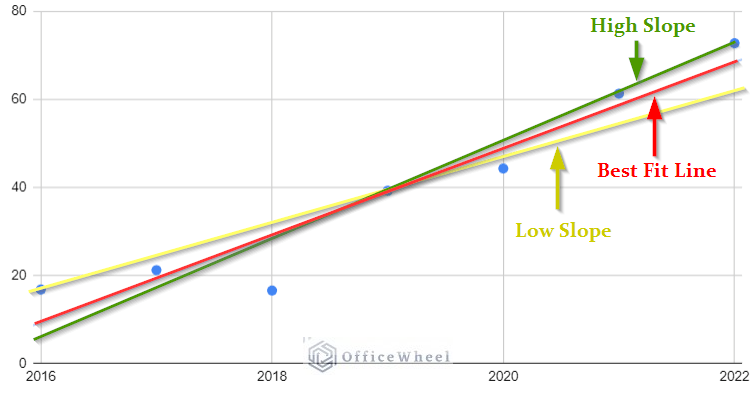
Uncertainty of slope is basically the comparison of the best fit line with the high or low slope.
There won’t be any slope uncertainty if our data is consistent and either increasing or decreasing at the same pace, giving us a straight line. However, there are some inconsistencies in the empirical data used for research.
In essence, Uncertainty of Slope is the amount of compensation we assign to a slope value in the event of a contradictory dataset.
Step-by-Step Procedure to Find Uncertainty of Slope in Google Sheets
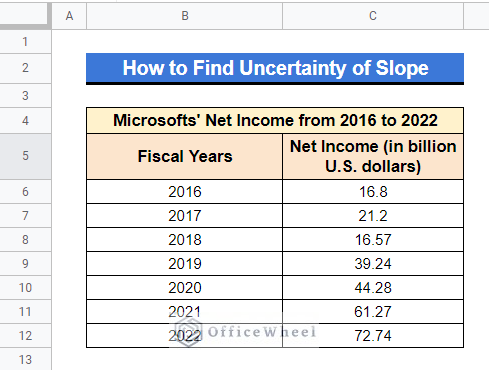
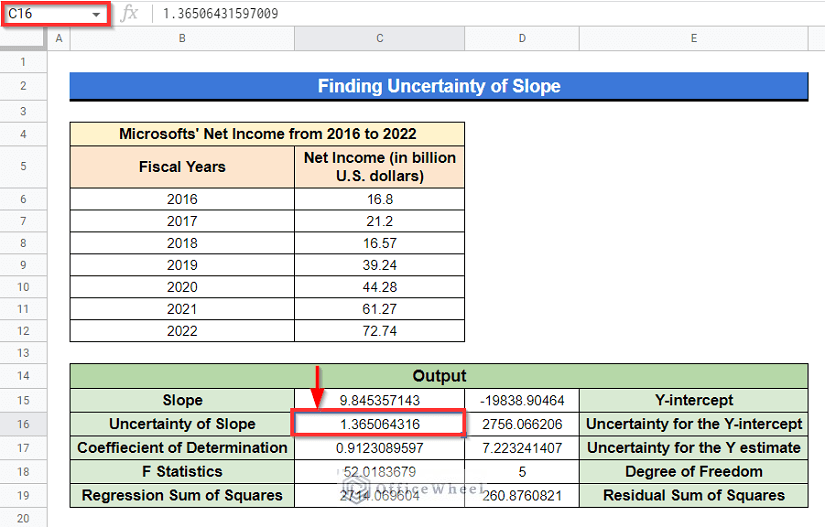
We will be using the following dataset as an example to demonstrate the method in this article. The dataset represents Microsofts’ Net Income from 2016 to 2022.
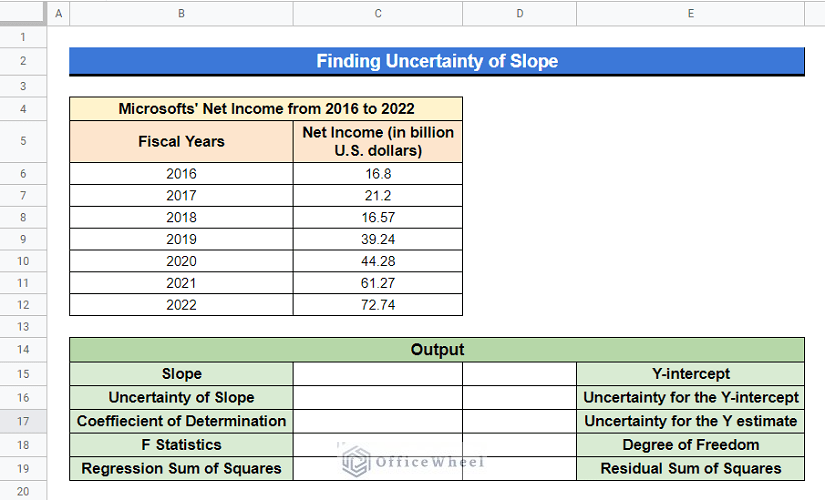
Step 1. Create Output Dataset
- The best way to find the uncertainty of slope is the use of the LINEST function in Google Sheets. This function returns not only the uncertainty value but also other parameters as well.
These are-
- Value of the Slope
- Y-intercept
- Uncertainty of Y-intercept
- Coefficient of determination
- Uncertainty of Y estimate
- F statistics
- Degree of Freedom
- Regression Sum of Squares
- Residual Sum of Squares
So, considering that, we will rearrange a dataset as follows for the output.
Read More: How to Find Slope of Graph in Google Sheets (With Easy Steps)
Step 2. Insert LINEST Function
At this moment, we’ll insert the LINEST function to get the uncertainty of the slope along with the other parameters.
- Select Cell C15, apply the following formula-
=LINEST(C6:C12,B6:B12,1,1)- Then just press Enter button to get the output. And the output will be as follows within Cell range C15:D19.
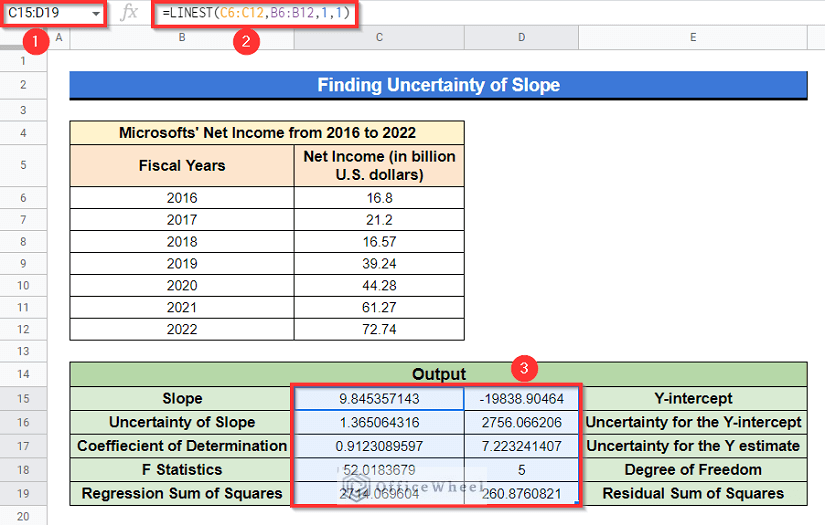
Here, in the formula-
- Cell range C6:C12 refers to the values of dependent variable Y.
- Cell range B6:B12 indicates the values of independent variable X.
- 1 means the best fit line will not go through the origin.
- 1 means it will return every parameter.
Read More: Find Value in a Range in Google Sheets (3 Easy Ways)
Step 3. Get Uncertainty of Slope
- Finally, have a look at Cell C16, you will get the value of uncertainty of slope there.
- Also, we got some other data like Slope, Coefficient of determination, Degree of freedom, etc.
Read More: How to Find Correlation Coefficient in Google Sheets
Similar Readings
- How to Use Find and Replace in Column in Google Sheets
- Find Hidden Rows in Google Sheets (2 Simple Ways)
- How to Find Median in Google Sheets (2 Easy Ways)
- Find Frequency in Google Sheets (2 Easy Methods)
- How to Find Merged Cells in Google Sheets (3 Ways)
How to Find Equation of Trendline in Google Sheets
While calculating the uncertainty of slope, you may also need the equation of the trendline too. There is an easy way to get that from Google Sheets. We are gonna show it here. We will be using the previous dataset as an example to find the equation of the trendline in Google Sheets.
Steps:
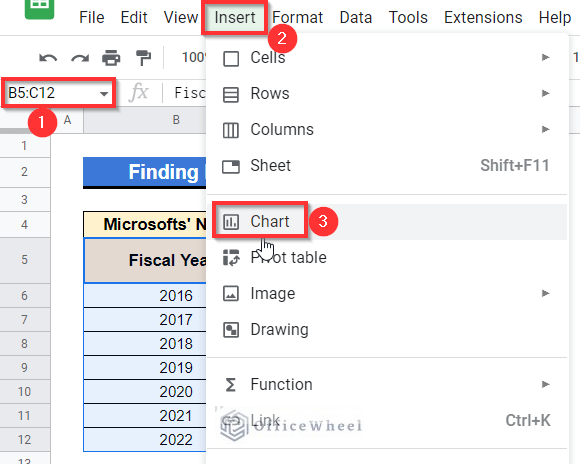
- First, select Cell range B5:C11, next select Insert at the toolbar, and choose Chart.
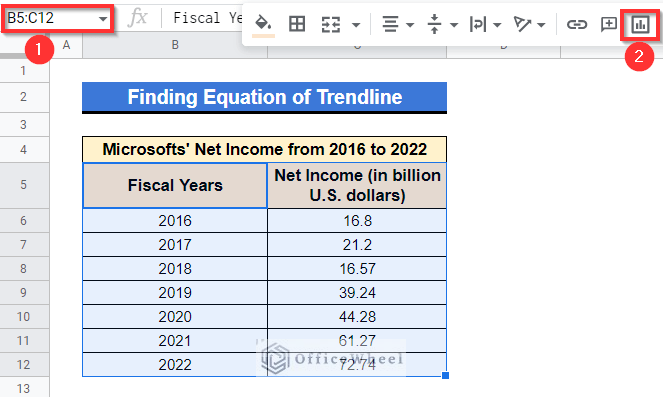
- Or simply left-click on the Insert chart ribbon from the toolbar.
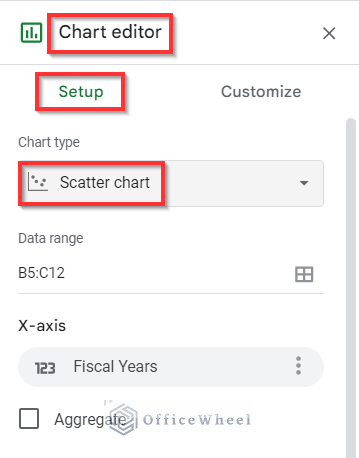
- After that, a chart will appear on your screen. Along with the chart, a sidebar titled Chart editor will also come up.
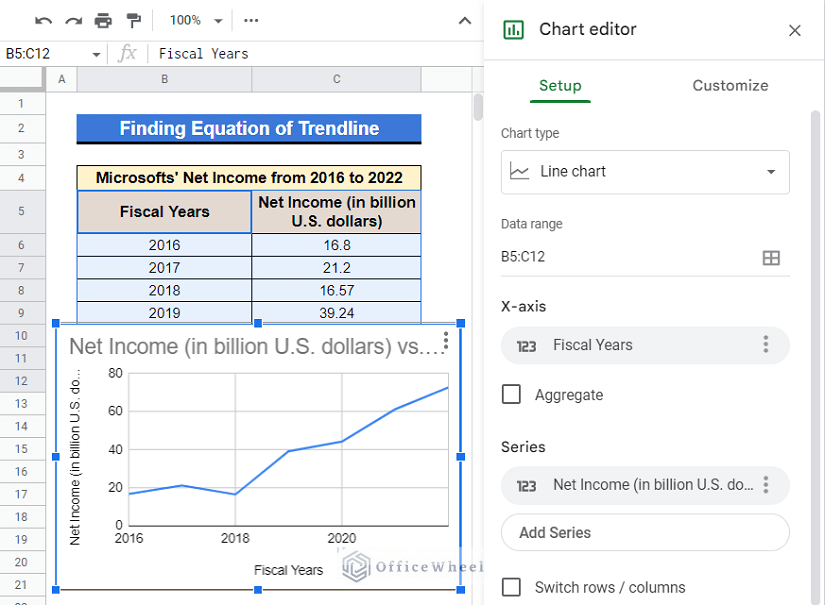
- From that sidebar, select the chart type as “Scatter chart”.
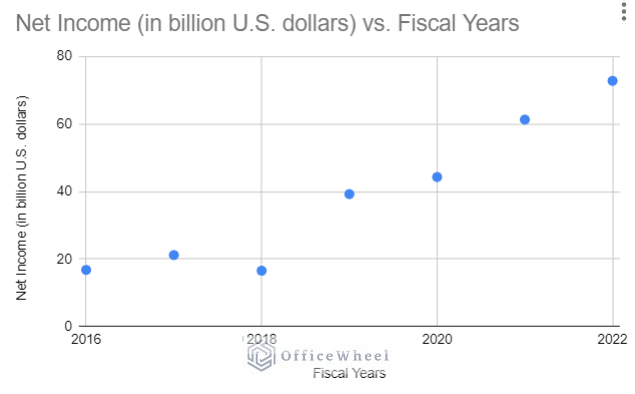
- At this point, the chart will be as follows-
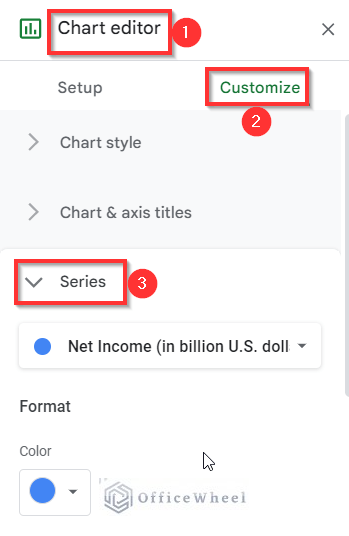
- Thereafter, go to the sidebar again, select Customize and then click on the drop down menu Series.
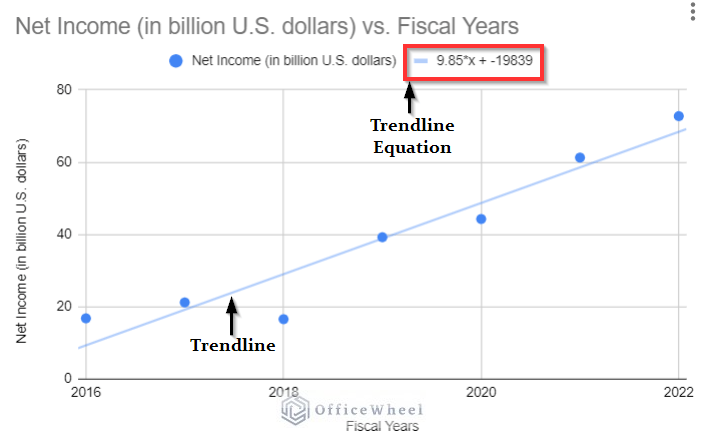
- Now, from there, mark the Trendline box, then select Use Equation from the Label drop down menu.
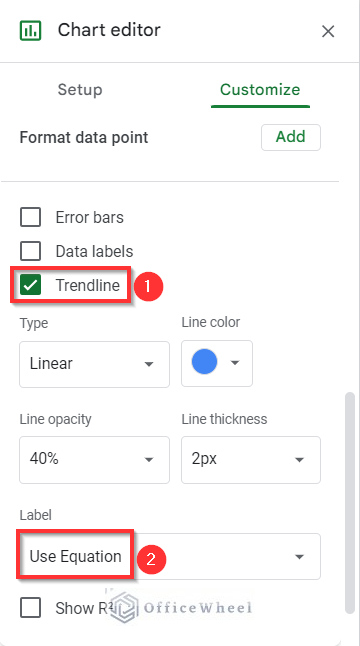
- Finally, you will see the trendline on your chart with the trendline equation above your chart.
Read More: How to Find the Range in Google Sheets (with Quick Steps)
Conclusion
The article contains an easy process to find the uncertainty of slope in Google Sheets. Hope this will help with your work, but if is there any query or confusion then please let me know in the comment box. And visit officewheel.com to explore more relevant articles.
Related Articles
- How to Find Trash in Google Sheets (with Quick Steps)
- Find Edit History in Google Sheets (4 Simple Ways)
- How to Find Linear Regression in Google Sheets (3 Methods)
- Find All Cells With Value in Google Sheets (An Easy Guide)
- How to Use FIND Function in Google Sheets (5 Useful Examples)
- Find and Replace with Wildcard in Google Sheets
- How to Find and Delete in Google Sheets (An Easy Guide)