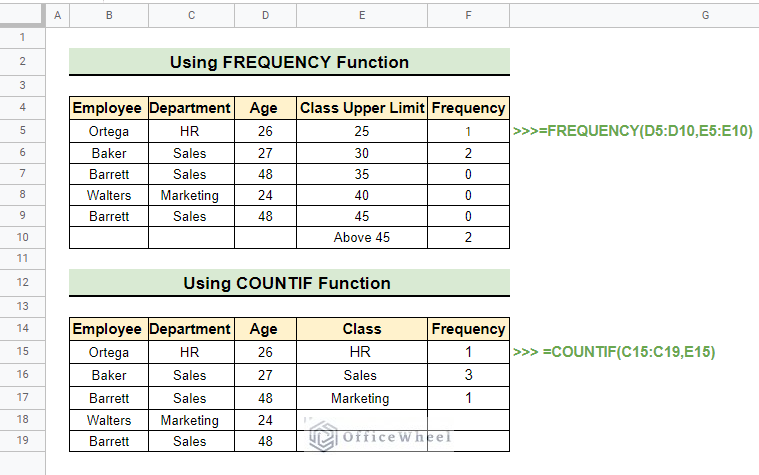
Frequency is a metric that gives us the idea of how frequently a particular data appears within a dataset. Calculating frequency is often necessary for analyzing data and taking data-driven decisions. Google Sheets has a couple of well-designed functions to find frequency.
In this article, we are going to discuss how to find frequency distribution in Google Sheets of specified classes.
A Sample of Practice Spreadsheet
You can download the spreadsheets from the link below. The spreadsheets contain a dataset we use here. After downloading you can practice on your own as we demonstrate here.
2 Easy Methods to Find Frequency in Google Sheets
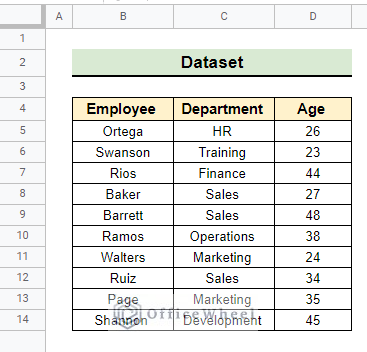
There may have various methods of finding frequency in Google Sheets. However, we are going to investigate the two easiest methods to find frequency using the following dataset.
1. Using FREQUENCY Function
Generally, the FREQUENCY function is the most popular function for finding frequency in Google Sheets. Using this method we can easily find the frequency of a class by defining the upper limit of the class interval.
📌 Steps:
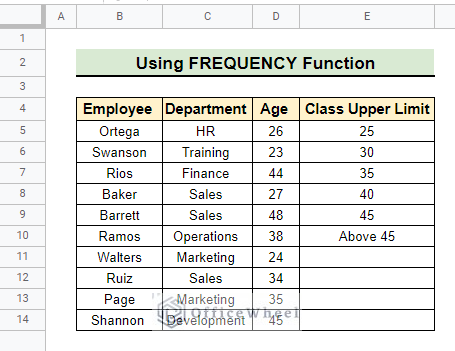
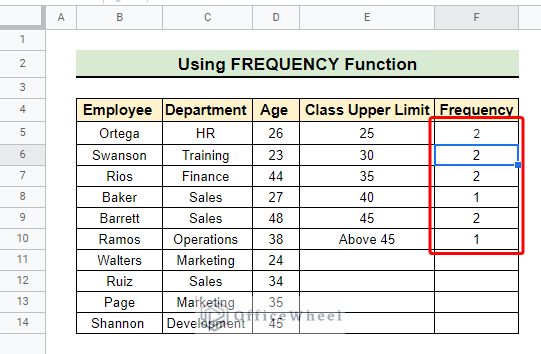
- First of all, we manually input the Class Upper Limit to find the frequency of Age for each class within this limit.
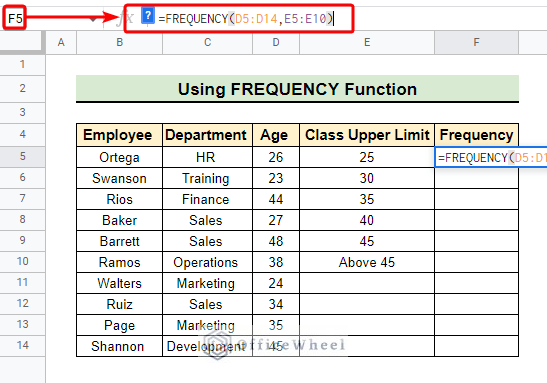
=FREQUENCY(D5:D14,E5:E10)- Then we select cell F5 and put the above formula in the formula bar and hit Enter.
- As a result, we get the frequency of all the classes as follows.
Read More: Find All Cells With Value in Google Sheets (An Easy Guide)
2. Applying COUNTIF Function
The COUNTIF function in combination with the UNIQUE function can perform the above task of finding frequency. In this method, we are going to find the frequency of each department of the Department column within the dataset.
📌 Steps:
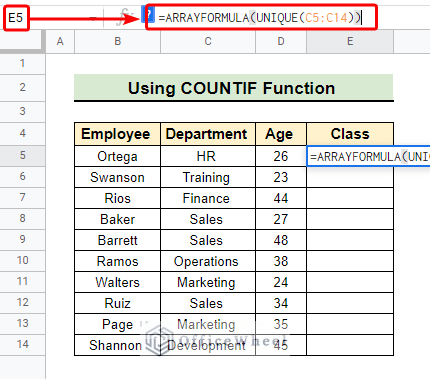
- Initially, we select cell E5 to find the Class or unique departments in the Department column.
=ARRAYFORMULA(UNIQUE(C5:C14))- Next, we insert the above formula in the formula bar and press Enter.
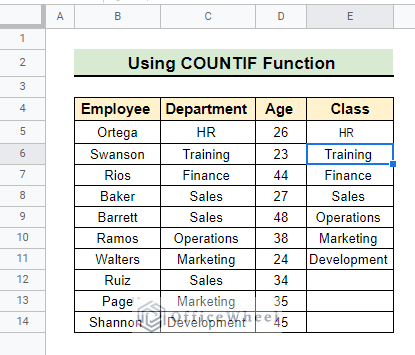
- Consequently, we get the unique departments as follows in the Class column.
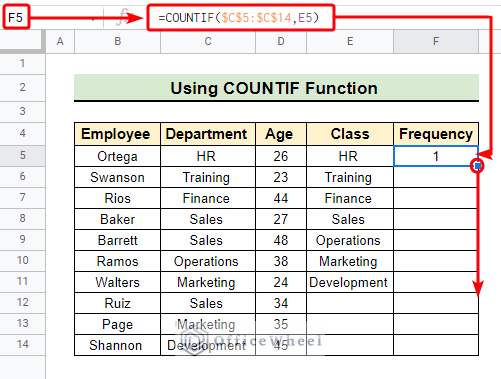
=COUNTIF($C$5:$C$14,E5)- Afterward, we select cell F5 to write down the above formula in the formula bar and press Enter.
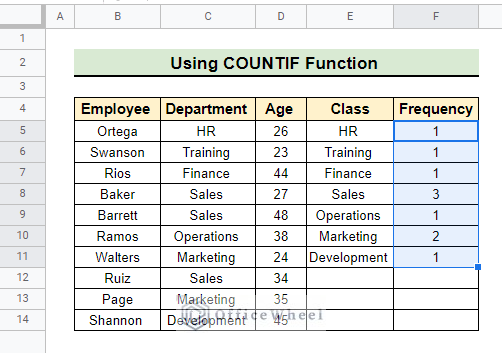
- As a result, we get the frequency of the first row. Then we use the fill handle tool to get the frequency of subsequent rows.
- Once we perform the fill handle operation we get the frequency of each department as follows.
Read More: How to Use Find and Replace in Column in Google Sheets
Similar Readings
- How to Find the Range in Google Sheets (with Quick Steps)
- Use FIND Function in Google Sheets (5 Useful Examples)
- How to Find and Delete in Google Sheets (An Easy Guide)
- Find and Replace with Wildcard in Google Sheets
- How to Search in Google Spreadsheet (5 Easy Ways)
How to Calculate Cumulative Frequency in Google Sheets
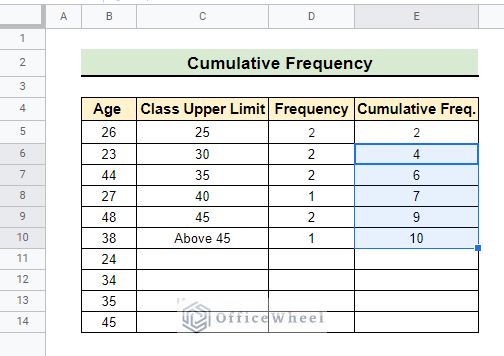
Now, if we want to find the cumulative frequency we can easily calculate that in Google Sheets. Here, we calculate the cumulative frequency of the frequencies we got from the first method.
📌 Steps:
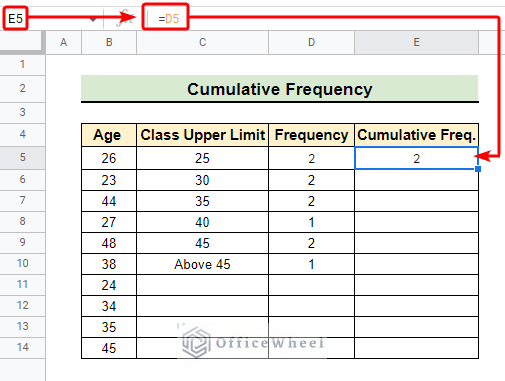
- Firstly we select cell E5 to find the cumulative frequency of the first class and set its value as D5 in the formula bar.
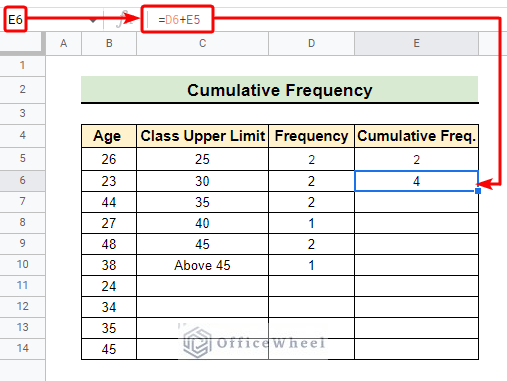
=D5- Then we select cell E6 and again write down the below formula in the formula bar.
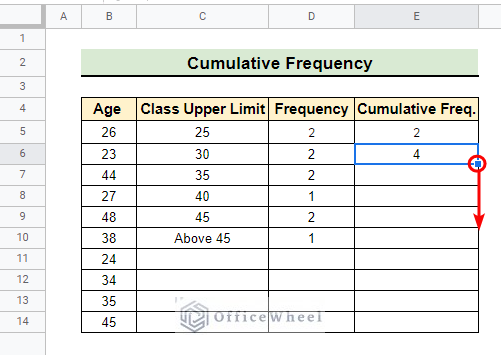
=D6+E5- Now, we perform the fill handle operation to get the cumulative frequency for other rows.
- Completion of the fill handle operation gives us the following output.
Read More: How to Find Hidden Rows in Google Sheets (2 Simple Ways)
How to Calculate Relative Frequency in Google Sheets
We can even calculate the relative frequency in Google Sheets just by following a few easy steps. Now, we are going to calculate the relative frequency of the frequencies we got in the second method of this article.
📌 Steps:
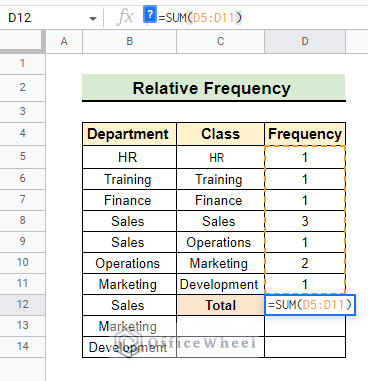
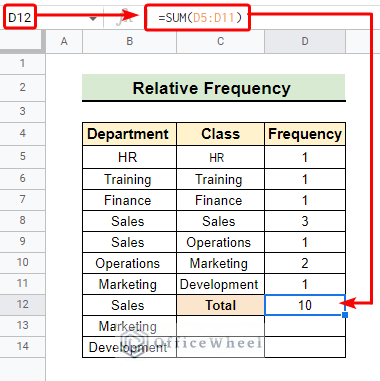
- At the very beginning, we select cell D12 to get the summation of the frequencies.
=SUM(D5:D11)- Then, we write down the above formula in the formula bar.
- This gives us the summation of frequencies in the selected cell.
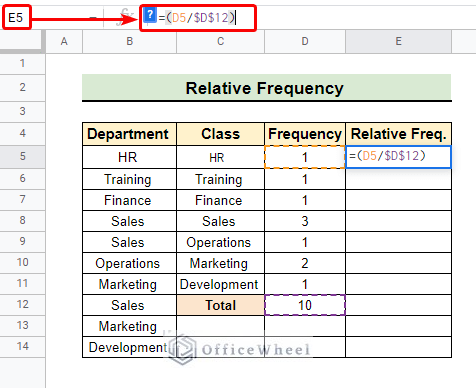
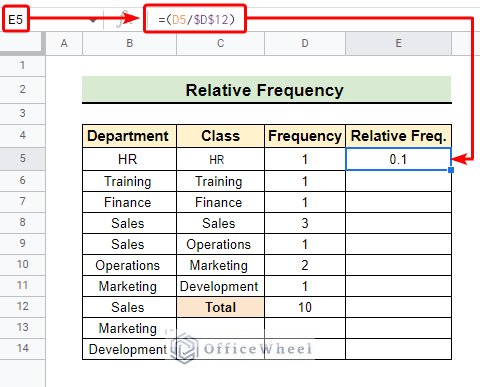
=(D5/$D$12)- After finding the summation of frequencies we select cell E5 and write down the above formula in the formula bar to calculate the relative frequency.
- As a result, we get the relative frequency of the first row in fractions.
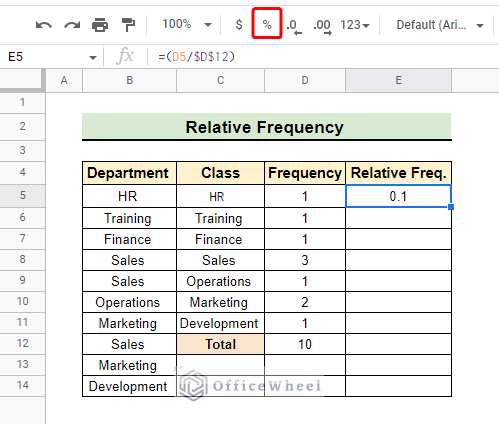
- Afterward, we use the Format as per cent icon as indicated to get the relative frequencies in percentage.
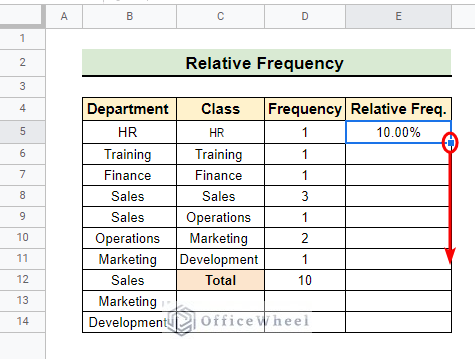
- At last, we use the fill handle tool to get the relative frequencies in percentage for the other rows.
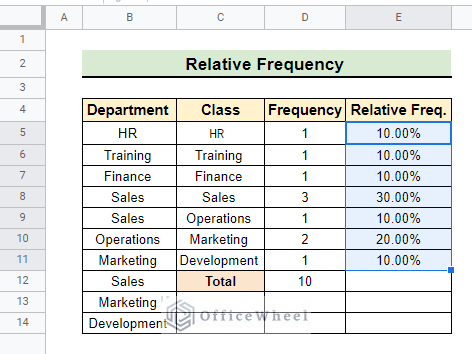
- Finally, we get the relative frequency in percentage for each class as follows.
Read More: Easy Guide to Replace Formula with Value in Google Sheets
Things to Remember
- Be careful in setting the upper limit of the classes when using the FREQUENCY function.
- Always extract the unique classes before finding frequency using the COUNTIF function.
Conclusion
In conclusion, I believe from now on you can easily apply the methods we discuss of how to find the frequency in Google Sheets. Furthermore, If you have any questions or suggestions regarding this article feel free to comment below and I will try to reach out to you soon. Visit our website OfficeWheel for the most useful articles.
Related Articles
- How to Find P-Value in Google Sheets (With Quick Steps)
- Find Slope of Trendline in Google Sheets (4 Simple Ways)
- How to Find Median in Google Sheets (2 Easy Ways)
- Find Uncertainty of Slope in Google Sheets (3 Quick Steps)
- How to Find Slope of Graph in Google Sheets (With Easy Steps)
- Find Linear Regression in Google Sheets (3 Methods)
- How to Find Correlation Coefficient in Google Sheets

