In business and finance, understanding the significance of data is crucial. One important aspect is determining the probability of a given event occurring. With Google Sheets, finding the p-value of your data is easy. This guide will show you how to find the p-value In Google Sheets.
A Sample of Practice Spreadsheet
You can copy our spreadsheet that we’ve used to prepare this article.
What Is P-Value?
A p-value is a number between 0 and 1 that helps us understand the results of a statistical test. It tells us how likely it is that the results of our experiment happened by chance, assuming that the null hypothesis is true. The null hypothesis is usually a statement that there is no difference or association between the groups being studied.
For example, a researcher wants to know if a new teaching method improves test scores. They randomly assign students to use the new or traditional methods. They give pre and post-tests and calculate the difference in scores. The researcher performs a t-test to find the p-value. If it is less than 0.05, it means that the new method improves test scores.
The p-value is used to help determine whether a difference between two sets of data is statistically significant. A p-value of less than 0.05 (or 5%) is generally considered to be statistically significant, which means that there is less than a 5% chance that the observed difference is due to random chance.
Introduction to TTEST Function in Google Sheets
The built-in TTEST function in Google Sheets runs a t-test, a statistical procedure to assess whether there is a significant difference between the means of two groups.
This function is our primary tool to find the p-value.
It helps to compare two sets of numbers and see if they are different or not. Such as a tool to check if one group is bigger or smaller than the other.
Syntax:
TTEST(range1, range2, tails, type)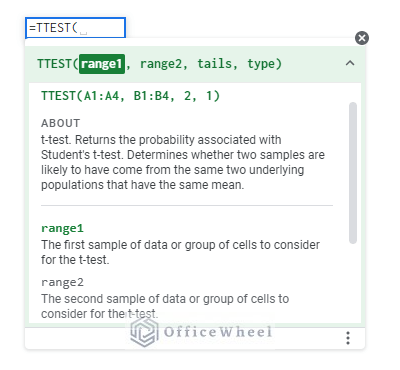
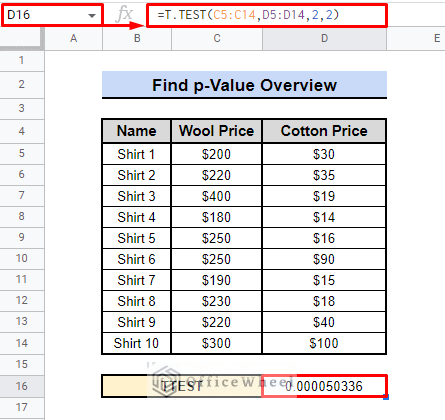
For example, we have data comparing the prices of wool and cotton shirts, and the hypothesis being tested is whether there is a significant difference in the average prices of the two types of shirts.
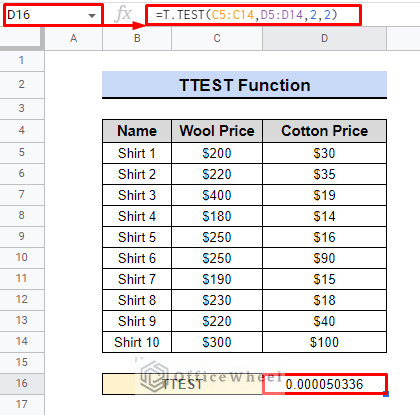
A low p-value (such as 0.000050336) indicates that it is unlikely that the difference in average prices of wool and cotton shirts is due to chance. It suggests that there is a significant difference in the average prices of the two types of shirts.
Step by Step Process to Find P-Value in Google Sheets
In Google Sheets, you can easily calculate p-values using built-in functions. Whether you’re conducting a hypothesis test or analyzing data for a research project, these steps will help you understand the significance of your results and make informed decisions.
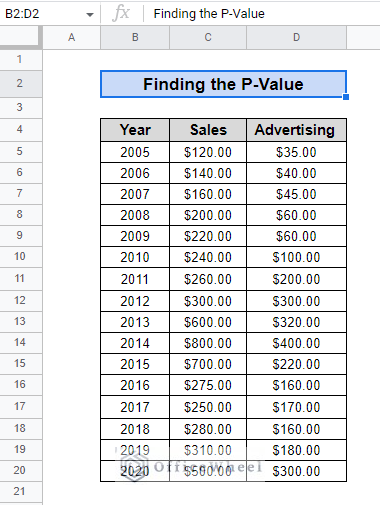
Assume that there is a dataset of a company containing data on sales and advertising expenditure from 2005 to 2020. We want to find out if there’s a relationship between sales and advertising expenditure. The null hypothesis is that there’s no relationship, while the alternative hypothesis is that there is a relationship.
We will use the TTEST function to calculate the p-value to determine if there’s enough evidence to reject the null hypothesis.
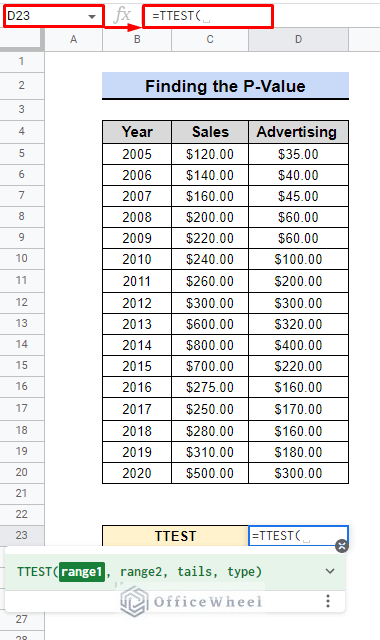
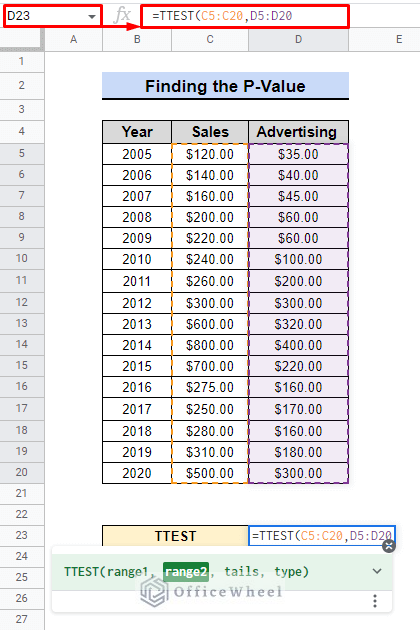
Step 1: Setting Data Range
- We need to select the two data ranges in which we want to find a relationship.
- First, we select cell D23 and use the TTEST function.
- Next, We then use C5:C20 as range1 and D5:D20 as range2.
Step 2: Defining Tails Number
There are two types of t-tests: a one-tailed test and a two-tailed test. The tails argument in the TTEST function is used to specify which type of test is being performed.
As the two samples are different, we will use 2 as distribution tails.
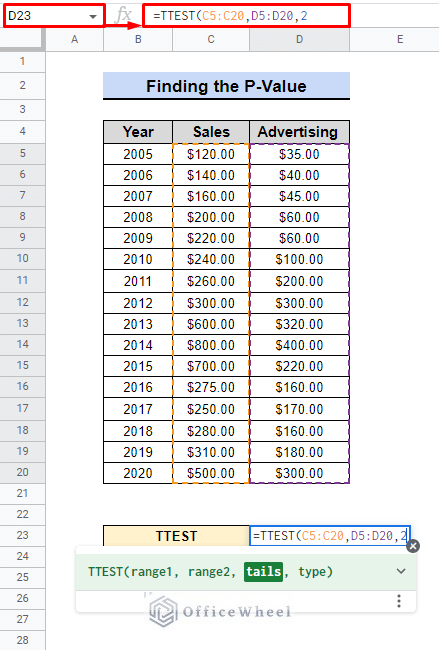
- To perform a one-tailed test to compare if the mean of one sample is greater or less than another, use a tails value of 1 or -1.
- Use a two-tailed test to compare if the means of two samples are different, use a tails value of 2. This is the default value when no tails argument is provided.
Read More: How to Find the Range in Google Sheets (with Quick Steps)
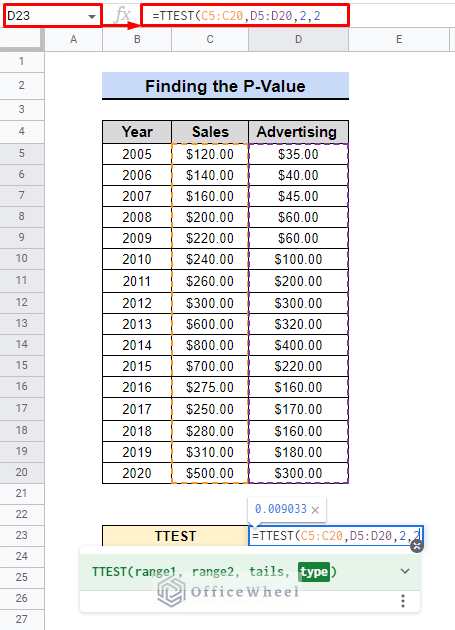
Step 3: Defining TTEST Type (Two Tail Example)
We will use the two-sample t-test in Google Sheets, which compares the means of two samples.
- To do this, we will use a TTEST type of 2.
- To perform a one-sample t-test, also known as a “1” type, we compare the mean of a sample to a known value.
- Two-sample t-test, also known as a “2” type, we compare the means of two different samples.
- For a paired t-test, or “3” type, we compare two sets of measurements taken from the same group of individuals.
Step 4: Interpretation of the Result
- Finally, press ENTER to see the result.
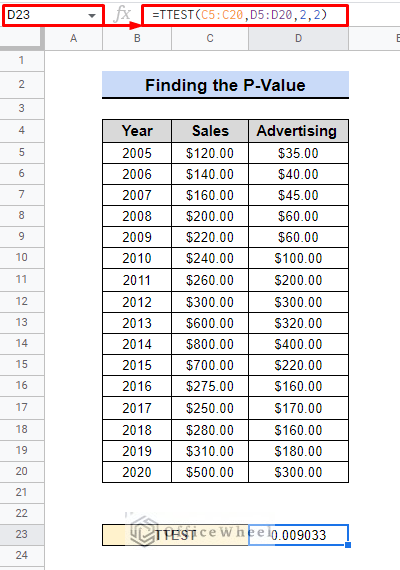
Understanding the Outcome: The TTEST result for the data of sales and advertising cost is 0.009033. Based on the two-tail, two-sample test result of 0.009033, There is a very low probability that the difference in sales and advertising cost over the years 2005 to 2020. It is not likely due to random chance, indicating moderate evidence of a significant difference.
In simple terms, The t-test result shows that the advertising cost and the sales have a moderate correlation over the years 2005 to 2020.
Similar Readings
- How to Find Hidden Rows in Google Sheets (2 Simple Ways)
- Use FIND Function in Google Sheets (5 Useful Examples)
- How to Find and Delete in Google Sheets (An Easy Guide)
- Find and Replace in Google Sheets (3 Ways)
- How to Use Find and Replace in Column in Google Sheets
Using Different Tail and Sample Test
Here are all the text combinations available in the TTEST function. These are used in the same dataset:
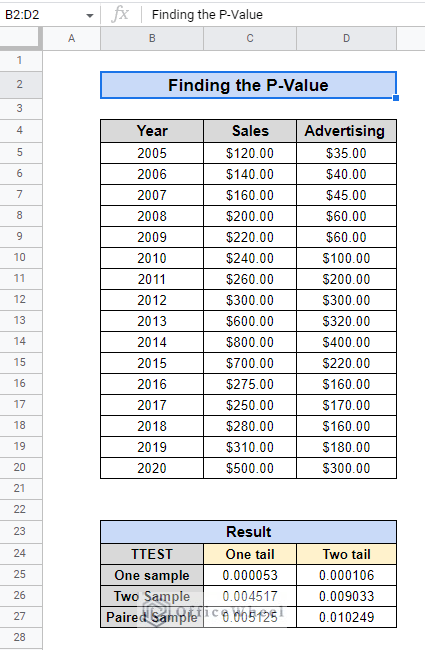
- One-tail, one-sample test result: 0.000053 – This result demonstrates a robust indication of a significant discrepancy between sales and advertising cost, with an infinitesimal likelihood that this difference is the result of chance.
- Two-tail, one-sample test result: 0.000106 – Similarly, this result also portrays strong evidence of a significant difference between sales and advertising cost, with an insignificantly low probability that this difference is due to random chance.
- One-tail, two-sample test result: 0.004517 – This result presents moderate evidence of a significant difference between sales and advertising cost, with a low probability that this difference is due to random chance.
- Two-tail, two-sample test result: 0.009033 – Likewise, this result also reveals a moderate indication of a significant difference between sales and advertising cost, with a low probability that this difference is due to random chance.
- One-tail, paired sample test result: 0.005125 – This result shows moderate evidence of a significant difference between sales and advertising cost, with a low probability that this difference is due to random chance.
- Two-tail, paired sample test result: 0.010249 – Furthermore, this result also exemplifies moderate evidence of a significant difference between sales and advertising cost, with a low probability that this difference is due to random chance.
In conclusion, all the test results conclusively indicate that there is a significant difference between the sales and advertising cost over the years 2005 to 2020 and it also demonstrates a moderate correlation between the two variables.
How Can You Decide Whether to Use One Tail or Two Tail Test
When it comes to deciding which tail is appropriate for a dataset to find p-value in google sheets, students usually become confused.
- One-tailed test is better when the direction of effect is known or predicted.
- Two-tailed test is better when the direction of effect is not known or predicted and when we want to be more cautious in drawing conclusions (It is the by default option in google sheets).
How to Choose Test Type
The sample test also varies depending on the characteristics of the dataset, which makes it difficult to determine which is best for that particular test to find the exact p-value in google sheets. The information below may help you decide on a test type.
One Sample Test
Compare a sample to a known population mean with a one-sample test when you have one sample and a specific value to compare it to. Example: Compare a sample of 100 t-shirt prices to $15.
Two Sample Test
Use a two-sample test for independent samples. Example: Compare new and older car models’ fuel efficiency using samples of 20 cars each.
Paired Sample Test
A paired sample test for dependent samples when comparing means of two groups. Example: Compare test scores of students before and after the new teaching method.
Read More: How to Find Slope of Trendline in Google Sheets (4 Simple Ways)
Potential Error Results with TTEST Function in Google Sheets
Using the TTEST function frequently results in a few mistakes. The following mistakes are frequent among people.
#N/A Error
Ensure that the lengths of the two array arguments match. It will produce an #N/A error if the dataset is shorter.
#NUM! Error
To avoid an #NUM! error, make sure the tails argument is either 1 or 2. The type parameter must also be equal to 1, 2, or 3.
#VALUE! Error
The function will yield a #VALUE! error if the tails or type argument contains non-numerical values.
Things to Remember
- We can use both TTEST and T.TEST to perform functions.
- The quantity of data points in range1 and range2 must be equal.
- In the function syntax, both tails and type must be numeric.
Conclusion
Using the TTEST function in Google Sheets to find p-values can provide valuable insights into the correlation and significance of data in the business and finance industries. By understanding the relationship between data sets and the level of confidence in that relationship, organizations can make informed decisions and improve their financial performance. This can aid in forecasting, budgeting, and identifying areas for improvement, making it an essential tool for any financial or business analyst. Visit OfficeWheel for more information and help.
Related Articles
- How to Find Median in Google Sheets (2 Easy Ways)
- Find Uncertainty of Slope in Google Sheets (3 Quick Steps)
- How to Find Correlation Coefficient in Google Sheets
- Find Frequency in Google Sheets (2 Easy Methods)
- How to Find Linear Regression in Google Sheets (3 Methods)
- Find Largest Value in Column in Google Sheets (7 Ways)
- How to Find Quartiles in Google Sheets (4 Useful Methods)