Suppose you are working on a dataset that contains every month’s sales and you need to analyze this data. Imagine how hard it could be. Because if you analyze every data manually then this procedure is very time-consuming and tiring. In this case, the pie chart is a helpful process. If you show your data through a pie chart then this is very easy to process and understand. But most of the time pie chart contains percentage by default. In this article, we will learn how to change pie chart percentage to number in google sheets.
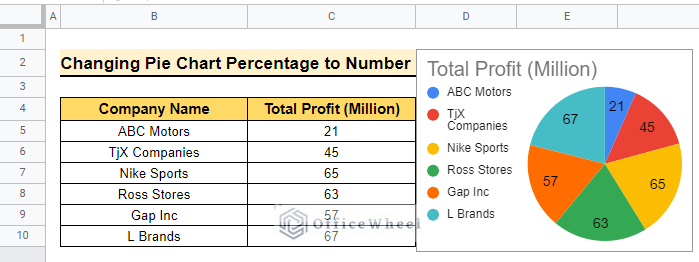
Here is the overview image to change pie chart percentage to number in google sheets. Hope you’ll learn more after you go through the total article.
A Sample of Practice Spreadsheet
You may copy the spreadsheet below and practice by yourself.
What Is Pie Chart in Google Sheets?
The Pie Chart is a type of graph that is a circle in shape and divided into portions where each portion represents a value. Here, each size of the portion or slice is proportional to the actual number in the dataset. Basically, a pie chart is a statistical graphical chart it is used when you need to show someone the percentage of the whole dataset or you need to represent if a part is large or small in the dataset. On the other hand, if there are two almost similar data in a dataset then you should avoid a pie chart.
Step by Step Procedures to Change Pie Chart Percentage to Number in Google Sheets
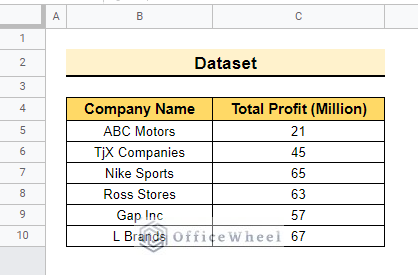
The below dataset contains Company Name and Profit of the leading companies. Here, we will learn how to change pie chart percentage to number in google sheets using the following dataset. So, let’s start.
Step 1: Create a Pie Chart
Now, we will create a pie chart using the following dataset.
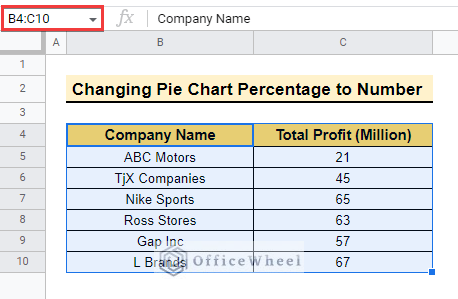
- First, select the dataset range B4:C10 to create the pe chart. As B4:C4 will be used as the header row.
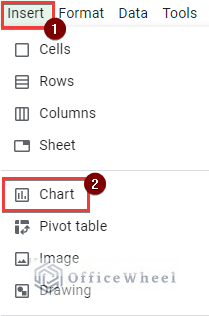
- Then, select Insert >> Chart to insert a chart in google sheets.
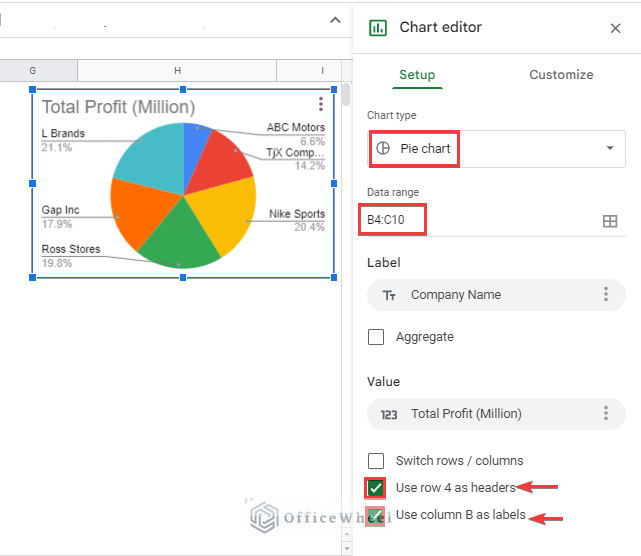
- After that, a Pie chart will appear with the given data as below.
- Therefore, the above data shows the details in the “Chart editor”. The Chart type is Pie chart, the Data range is B4:C10, row 4 is used as the header row and Column B is used as labels.
Read More: How to Make a 3D Pie Chart in Google Sheets (With Quick Steps)
Similar Readings
- How to Change Pie Chart Colors in Google Sheets
- Copy a Pie Chart from Google Sheets (5 Easy Ways)
- How to Change Title of Pie Chart on Google Sheets
- Label Pie Chart in Google Sheets (With Easy Steps)
Step 2: Change Percentage to Number in Pie Chart
Following, we will change the pie chart percentage to number using the above data.
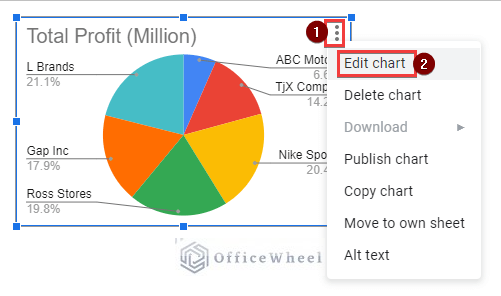
- Now, select the 3 dots in the pie chart and select Edit chart to edit the chart.
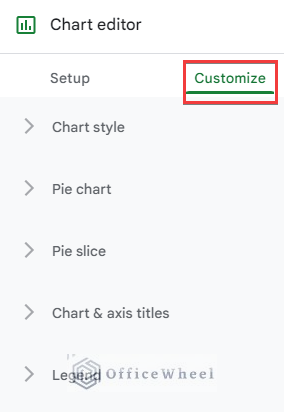
- Again, Chart editor will pop up and select Customize as below.
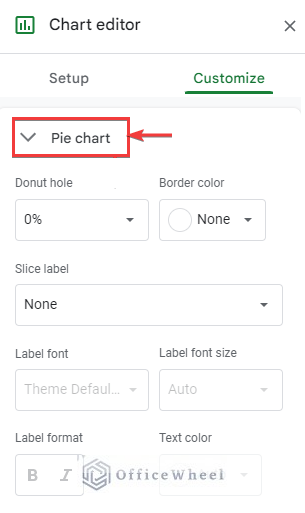
- Moreover, select Pie chart from Customize as follows.
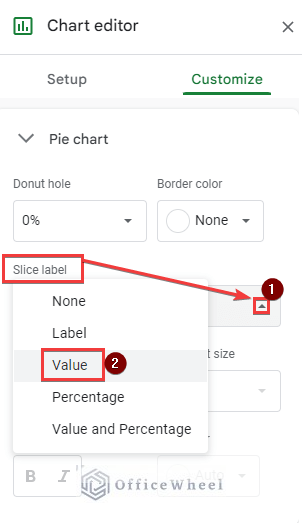
- Consequently, select Value from Slice label to get the value in the pie chart.
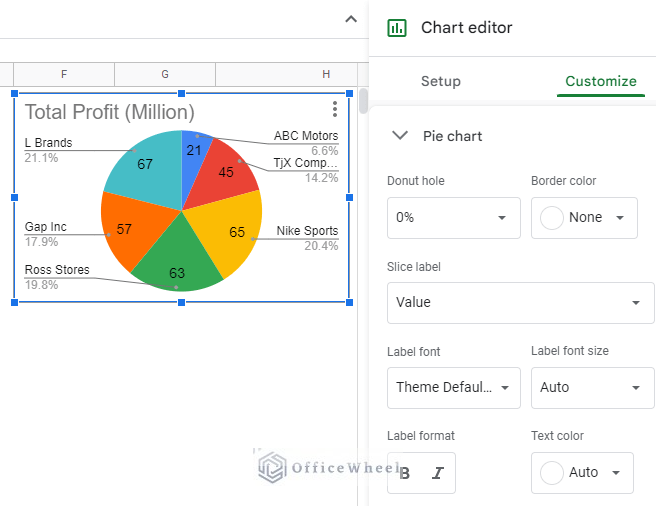
- Now, the output of choosing value is below.
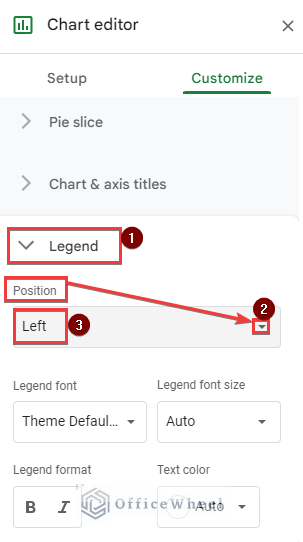
- After that, select Legend >> Position >> Left from customize to remove the percentage from the chart.
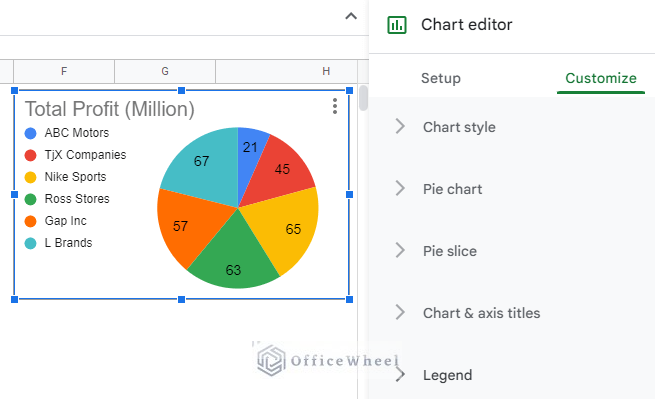
- Finally, the output to change the pie chart percentage to number is below.
Read More: How to Edit a Pie Chart in Google Sheets (5 Core Features)
Things to Remember
- The pie chart always shows the percentage of the data by default.
- Your selected first row is considered the header row. But you can change the feature.
Conclusion
In this article, we explained how to change pie chart percentage to number in google sheets with practical examples. Hopefully, the methods will help you to apply this feature to your own dataset. Please let us know in the comment section if you have any further queries or suggestions. You may also visit our OfficeWheel blog to explore more Google Sheets-related articles.
Related Articles
- How to Subtract a Percentage in Google Sheets
- Google Sheets Calculated Field Percentage of Total in Pivot Table
- How to Calculate Percentage Change in Google Sheets (4 Ways)
- Remove Percentage Sign in Google Sheets (6 Ways)
- How to Use TO_PERCENT Function in Google Sheets
- Calculate Percentage in Google Sheets (4 Ideal Examples)
- How to Make a Percentage Chart in Google Sheets (3 Ways)
- Calculate Percentage Increase in Google Sheets (4 Ways)

