In Google sheets, you can present your data with great visual formatting by inserting charts. You can add and change the chart format in the easiest and quickest way. In this article, we will explain how to change pie chart colors in Google Sheets.
A Sample of Practice Spreadsheet
You can download the spreadsheet and practice the techniques by working on it.
Step by Step Procedure to Change Pie Chart Colors in Google Sheets
Like other editing options in the chart, the color-changing option is very handy and simple to use. To analyze the dataset, you can insert any type of chart. But as we want to show the color-changing technique in a pie chart so here we add a pie chart.
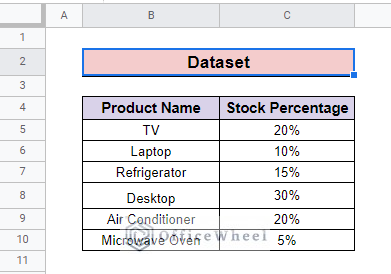
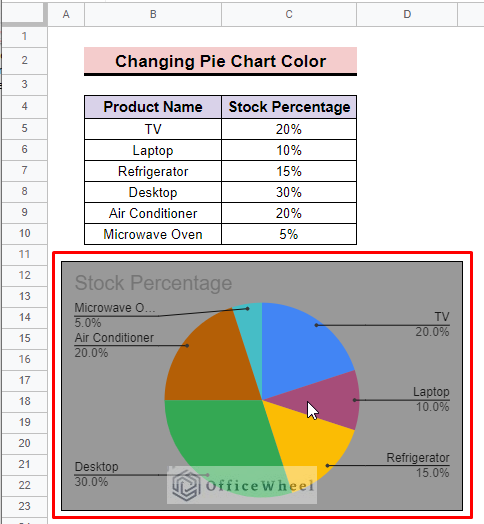
Step 1: Creating Dataset
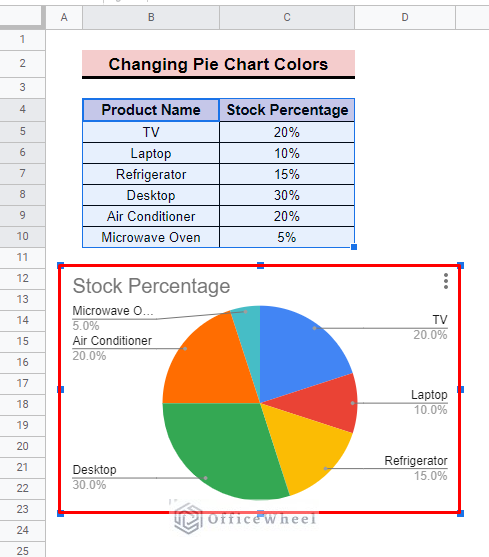
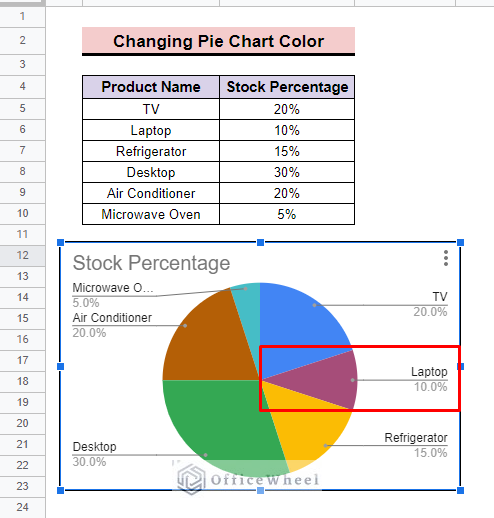
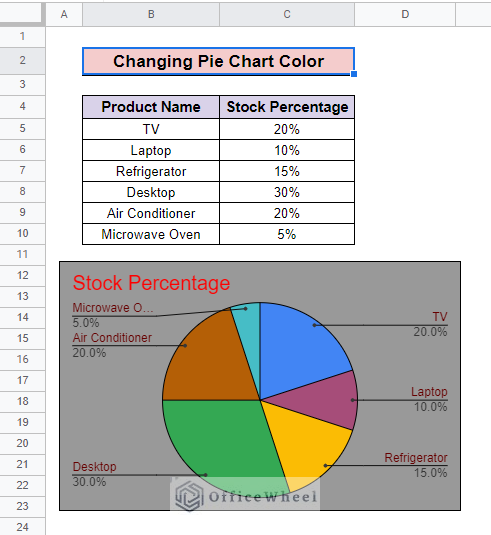
To change the color in a pie chart first you have to create a dataset. Here, we develop a dataset that contains two columns: Product Name and Stock Percentage.
Step 2: Inserting a Chart
After creating a dataset now it’s time to add a chart. Here, we add a pie chart to show the whole steps. So, to add a pie chart,
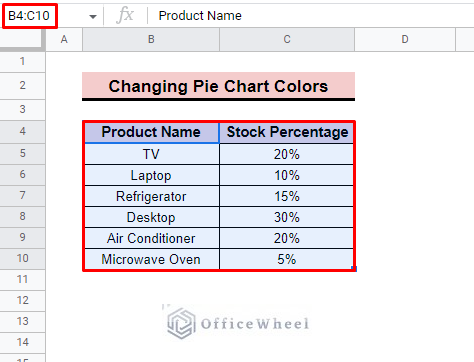
- First, select the entire dataset from which you want to create the chart. Here we select data range B4:C10.
- Then go to the Insert bar and select the Chart option.
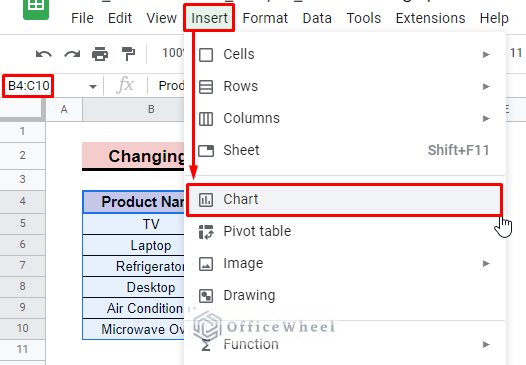
- After clicking on the Chart option, a chart will automatically be added to the spreadsheet. Here, we add a pie chart.
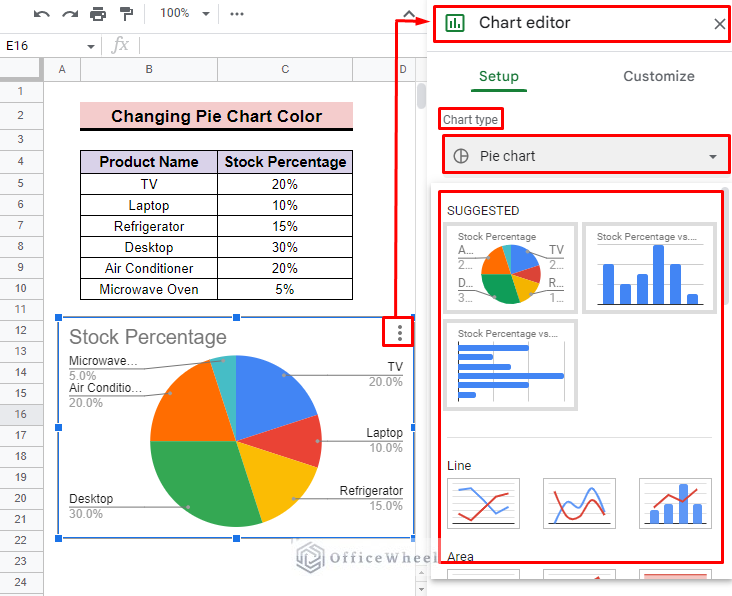
- Additionally, you can add other types of charts as well by using the Chart editor option and selecting any chart type from the suggested list.
Step 3: Changing the Color of Different Pie Chart Sections
After inserting the chart in the dataset now you can edit the chart as per your wish. You can customize the slice color, background, border, size, and everything you want.
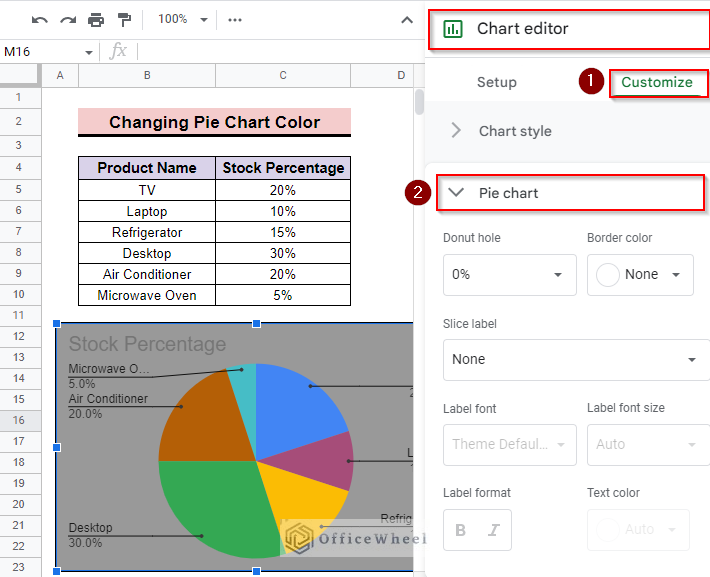
1. Change Slice Color
In case of color change, you can change the slice color of the pie chart as well as the background and border color. To change the slice color,
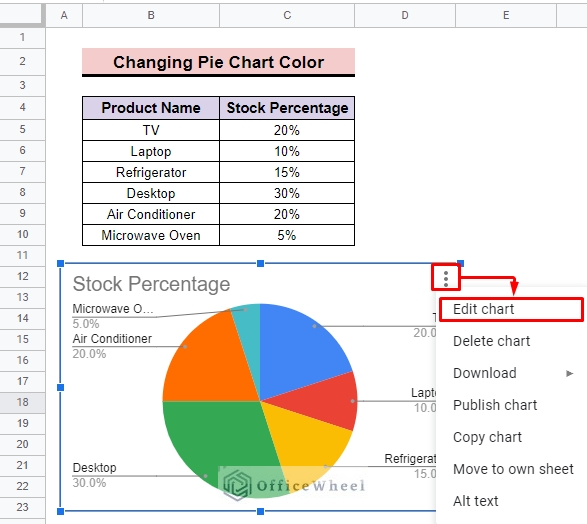
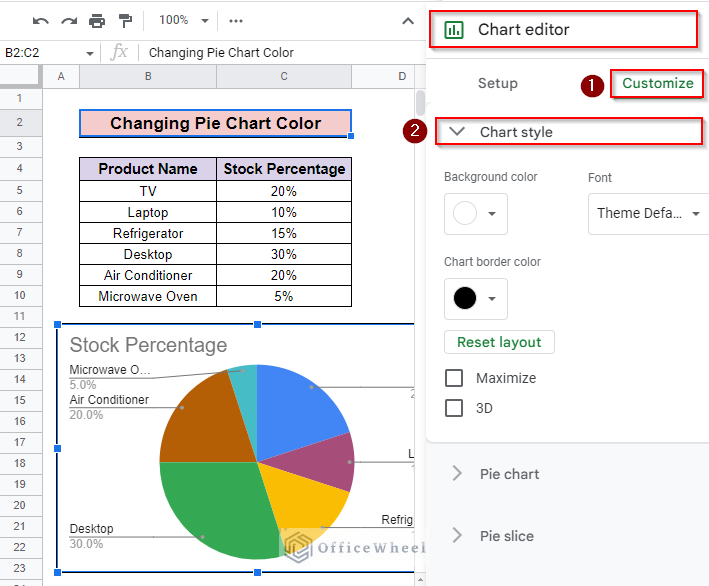
- First, click on the three dots icon situated in the top right corner of the chart and select the Edit chart option. This should open the Chart Editor.
- Then in the Chart editor bar click on the Customize option.
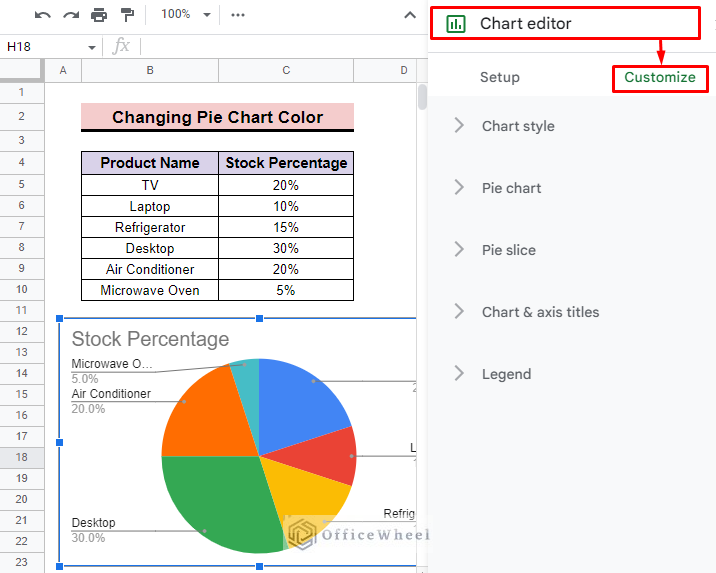
- Now press the Pie slice and expand the bar.
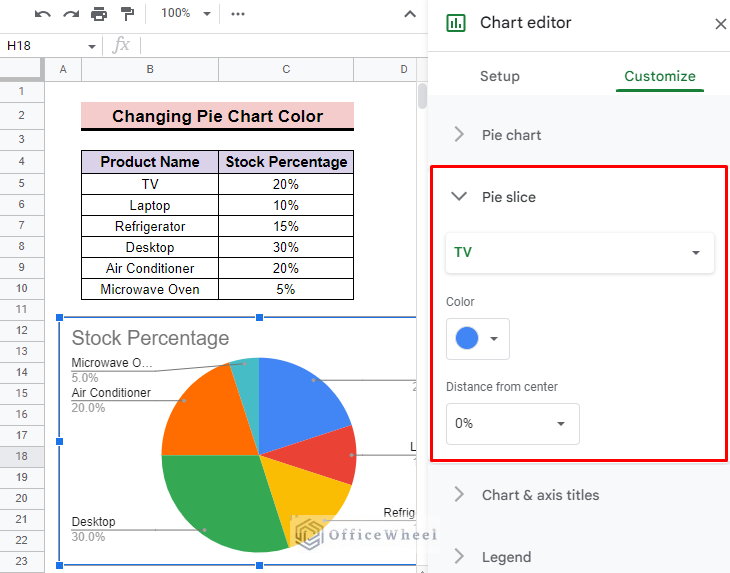
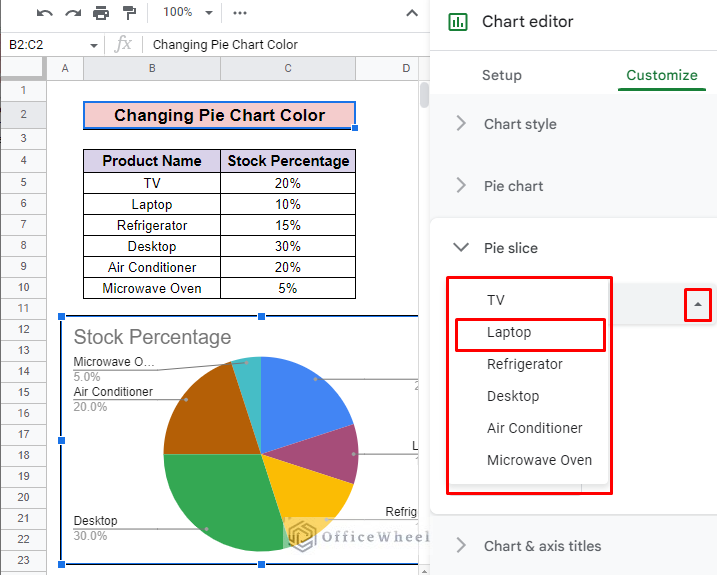
- In the Pie slice bar click on the dropdown list to show all the values and you can select anyone from the list which color you want to change. Here, we select the Laptop as an example.
- Now click the Color dropdown list and choose any color from the list.
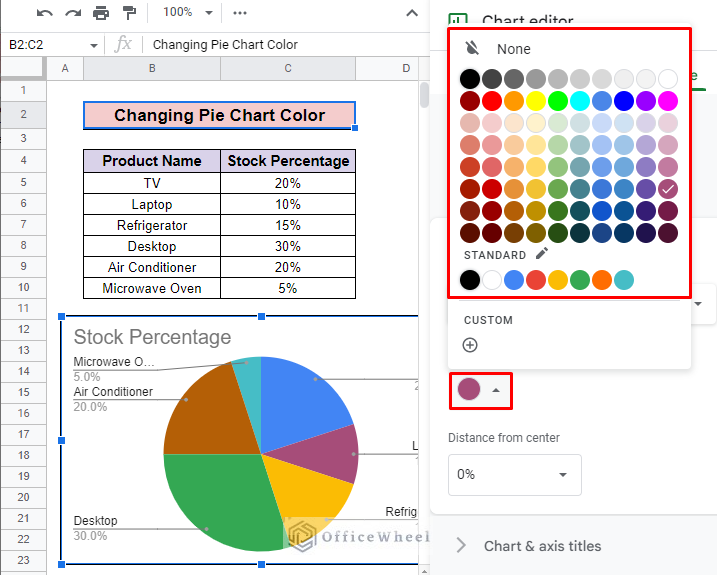
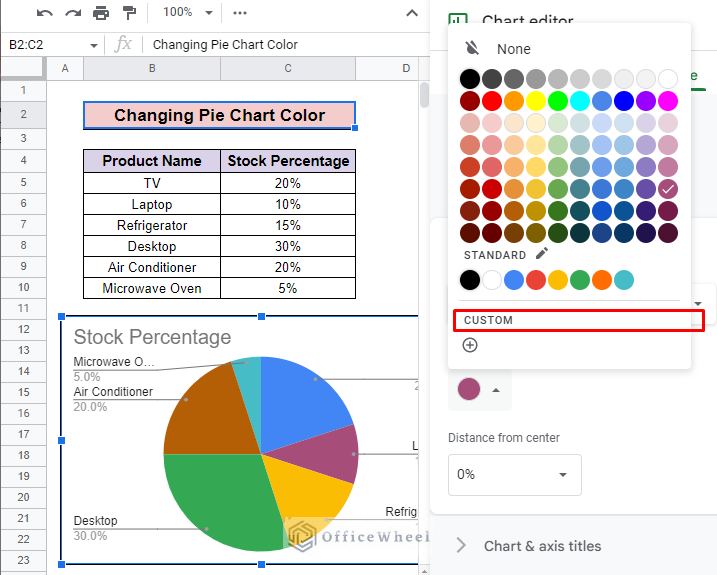
- Additionally, you can also customize your own color by choosing the CUSTOM feature.
- By applying the same process, you can change the color of all the slices in the pie chart.
- Finally, you can find the customized color for the Laptop in the chart.
Read More: How to Edit a Pie Chart in Google Sheets (5 Core Features)
2. Update Background and Border Color
To change the background and border color of the chart,
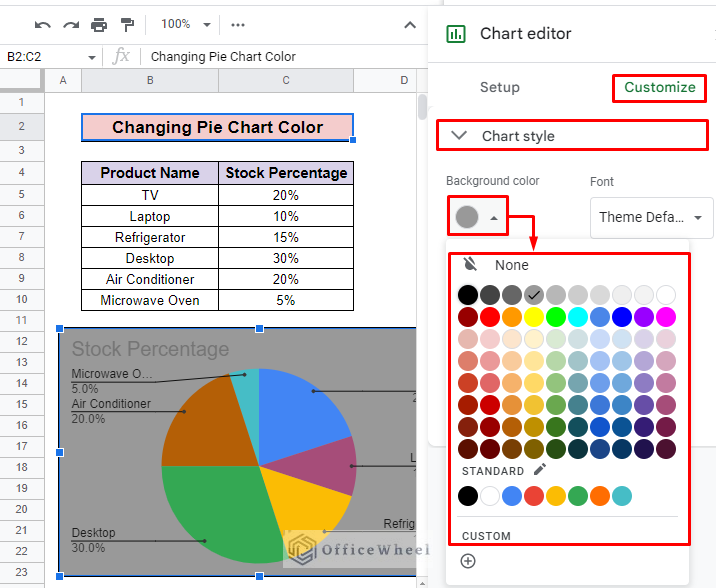
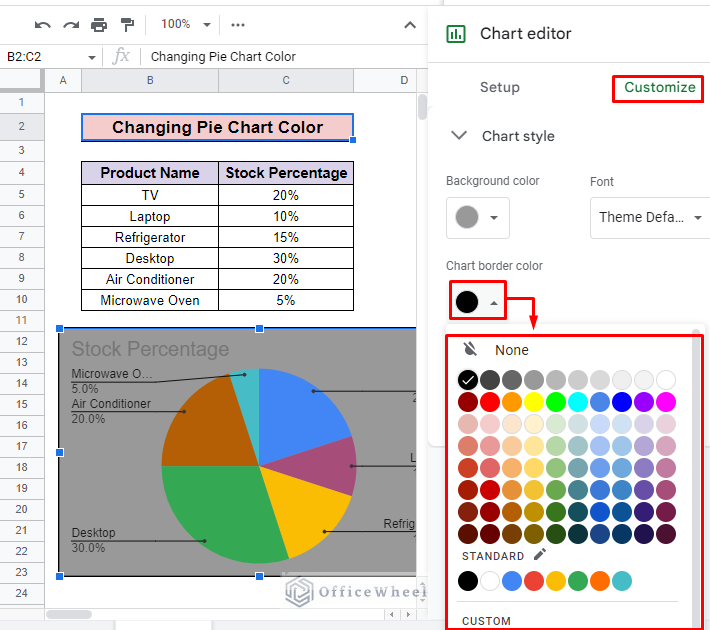
- First, go to the Chart editor and select the Customize tab. Then expand the Chart style option.
- Now select any preferable color from the Background color dropdown. Here, we choose light ash color for the background color.
- Moreover, you can also change the color of the chart border by using the dropdown of the Chart border color.
- You can find the background and its border change with the color you choose.
3. Modify Pie Slice Border Color
If you want to customize the chart slice border color,
- In the Chart Editor option, go to the Customize tab and expand the Pie chart option.
- By default, the Border color is set to None.
- To change this, go to the Border color dropdown and select any preferable color.
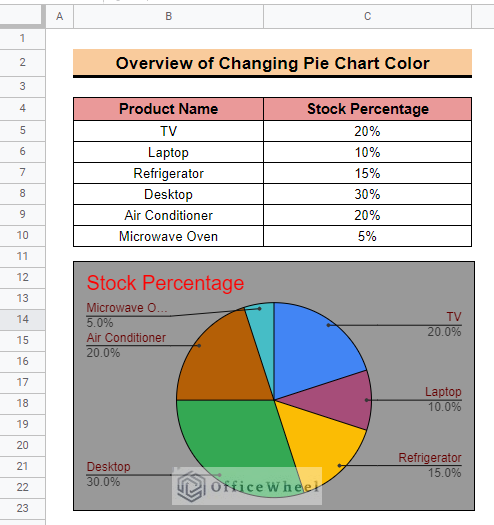
- Here we select the black color and the output you can see in the chart. We are keeping things simple.
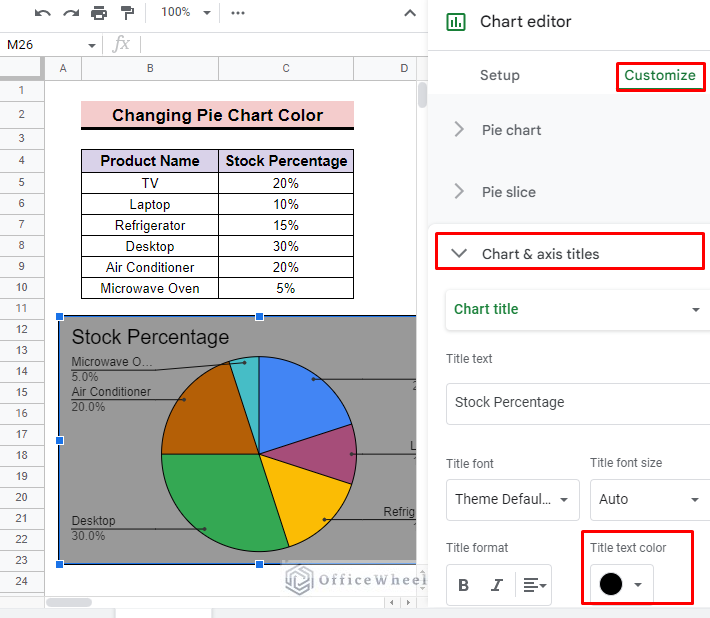
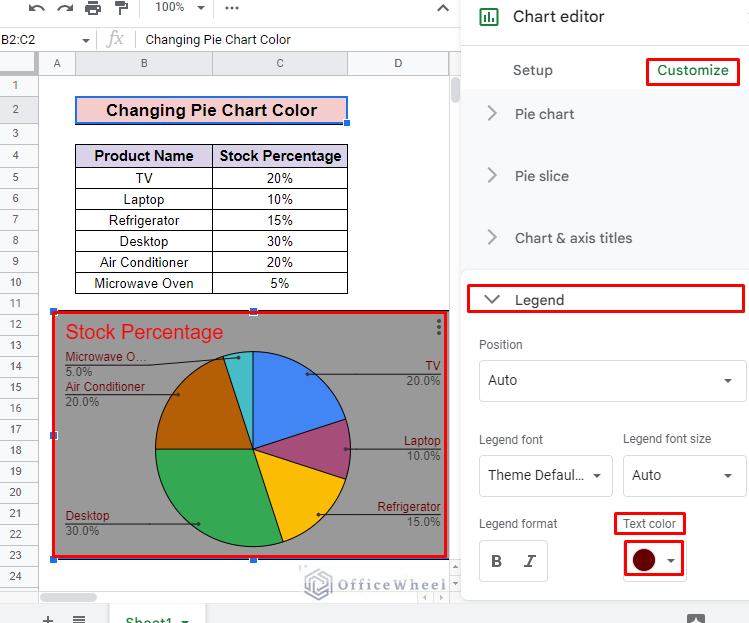
4. Alter Title and Legend Color
You can also change Title of Pie Chart and legend color by applying the same process. For the title color,
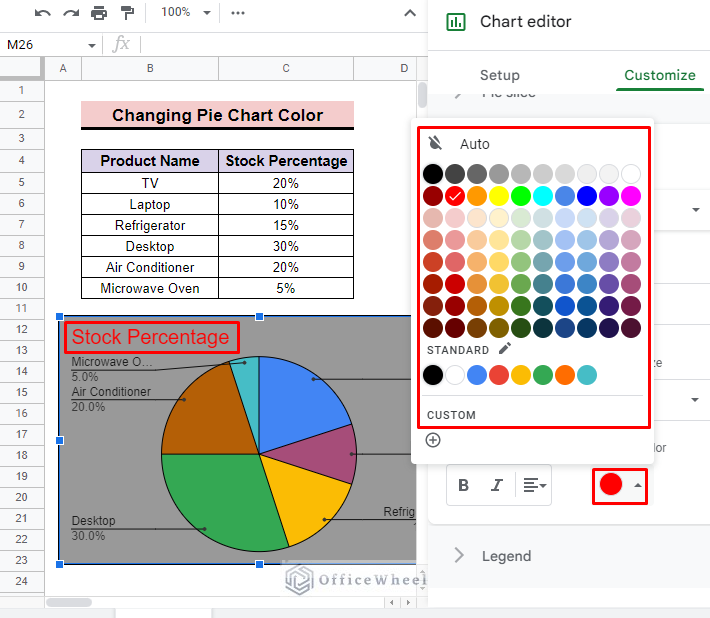
- In Chart editor, go to Customize and expand the Chart & axis titles. Now you will find the Title text color.

- Now use the color dropdown list and select any color from the color tab. Here, we select the red color, and you can see the changing color in the title in the following image.
- To change the color of the legend, expand the Legend tab and select the Text color dropdown to change the color.
Step 4: Final Output
After updating all color preferences, you will find the output in the chart instantly.
Why Is It Important to Change the Color of a Chart in Google Sheets?
As Google Sheets is mostly used for professional purposes, so when you want to visualize or represent any data with charts you have to bear in mind the company’s specific pattern and brand identity.
To follow the company’s brand pattern and norms you have to customize the color of the charts and represent it as per the company’s requirements.
In simple words, if you want to raise your company you have to present your data with their specific brand patterns, not the default pattern. So, it is very important to change the color of the charts.
Things to Remember
- To apply dark or light versions of any color you can use the custom color option in the color box.
- Though by default the chart has no background color. But you can use color on the background. In that case, light color is always a preference.
- There is no gradient option on the chart.
Conclusion
We believe this article will be helpful for you and you will gain a clear concept of how to change pie chart colors in Google Sheets. Moreover, you can also visit the OfficeWheel website to explore more about Google Sheets.