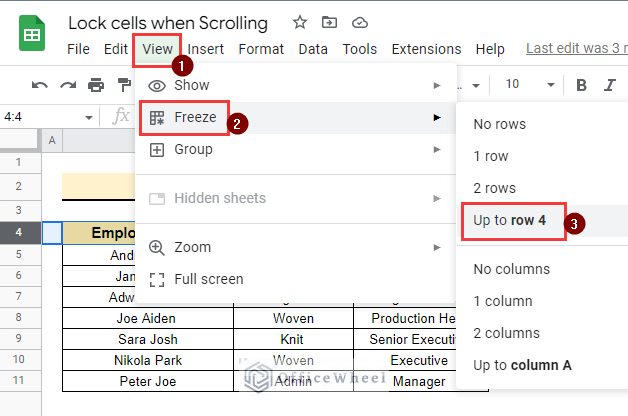
Suppose you are working on a dataset where you need to input data every day and the dataset is getting larger every day. In this case, it is a matter ...
In Google Sheets, sometimes we want to find unique values from a huge dataset. But unfortunately, if the dataset contains any blank cell, this also ...
While working in Google sheets we need to add single or multiple columns. In case of adding huge data sometimes we need to insert multiple columns. ...
The Simple Moving Average (SMA) constantly adds up an agency's closing price and divides the sum by the number of periods to get the average price of ...
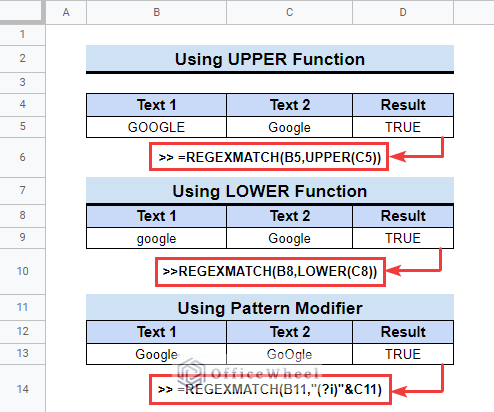
The REGEXMATCH function is a very helpful tool in Google Sheets. However, this function is case-sensitive. So, sometimes it eliminates some matches ...
Working on a large dataset is very normal in our day-to-day work life. But sometimes you need to find out very old values and to find the old values ...
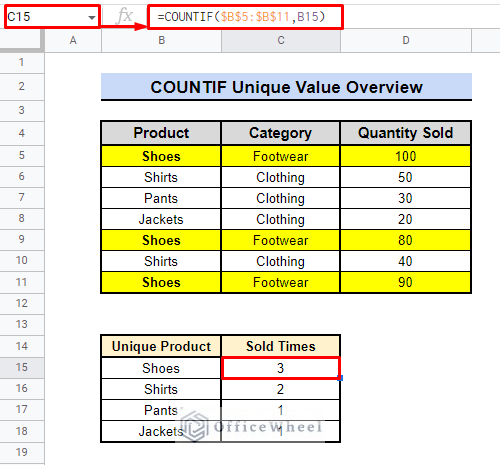
Using the COUNTIF and UNIQUE functions in Google Sheets can greatly benefit businesses and finance professionals by quickly identifying and tracking ...
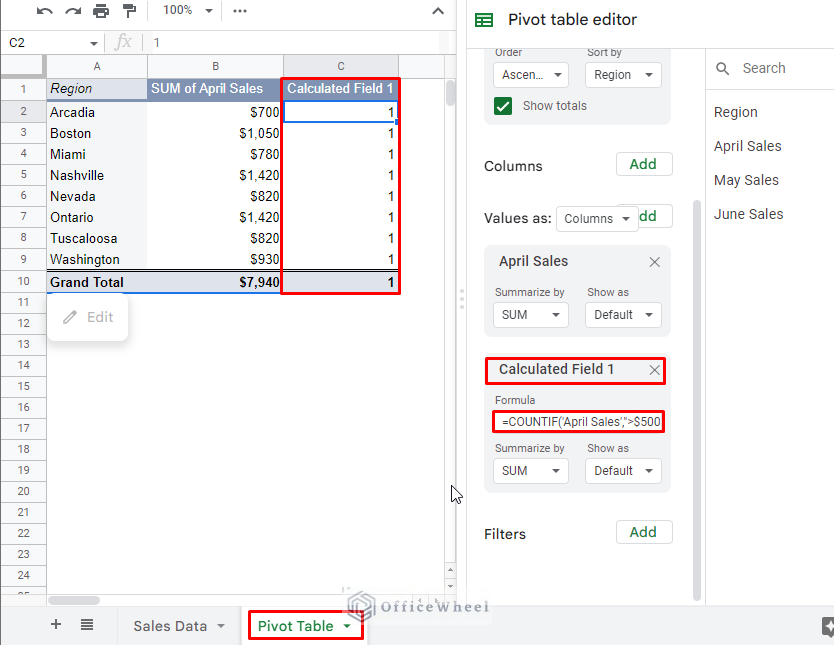
Users of Google Sheets have access to a wide range of chart types to assist them to visualize their data. However, simply displaying a chart with a ...
A checkbox is an interactive feature in Google Sheets that we can activate or deactivate within a cell. When the checkbox is checked, it has a value ...


![[Solved] Google Sheets Double Click Fill Down Not Working](https://officewheel.com/wp-content/uploads/2023/01/google-sheets-double-click-fill-down-not-working-10.png?v=1698043810)


