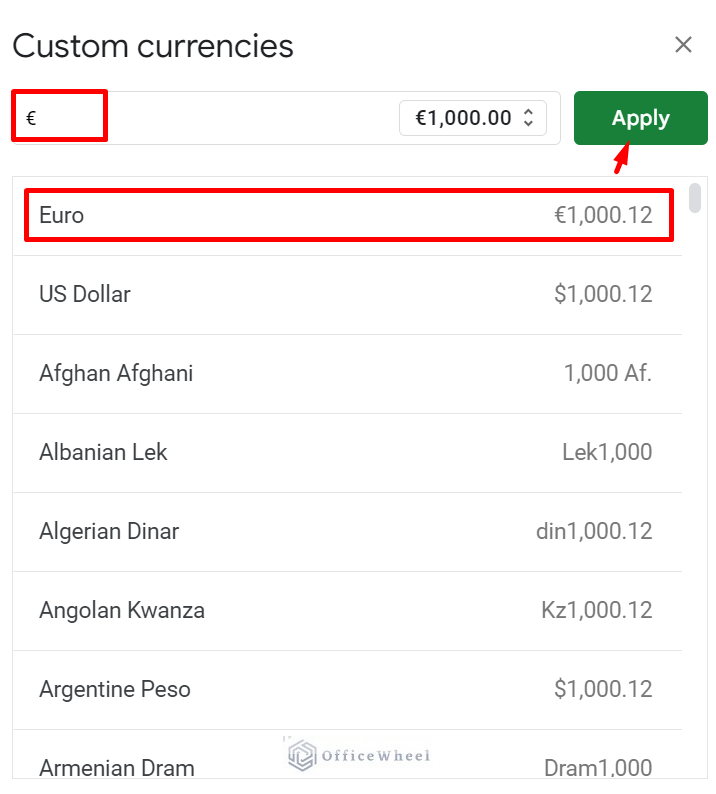
For working with monetary data in a worksheet, we must know how to insert different currencies. In this article, we will discuss a few approaches how ...
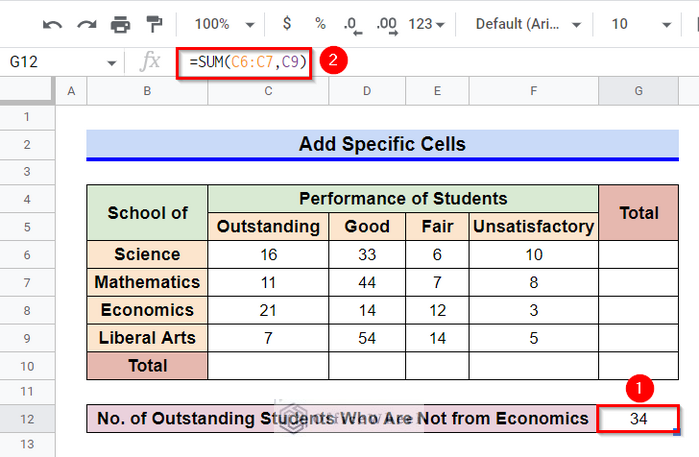
Adding some cells from a row, column or array is one of the most common things one can do in Google Sheets. The SUM function in Google Sheets can be ...
One feature is crucial when working online with a program like Google Sheets, and that feature is comments. You can collaborate on ideas, conflicts, ...
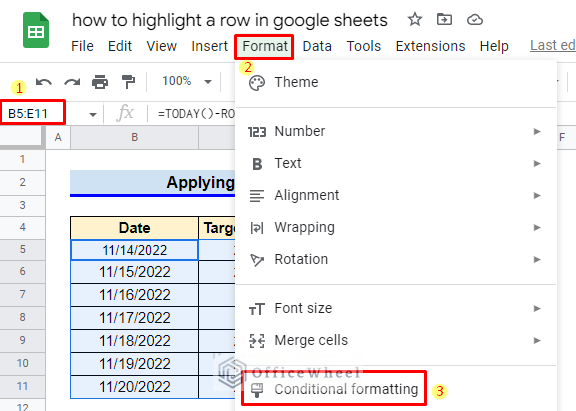
Highlighting a row based on today’s date is quite easy to achieve if you know the right method. In this article, we will discuss how to highlight a ...
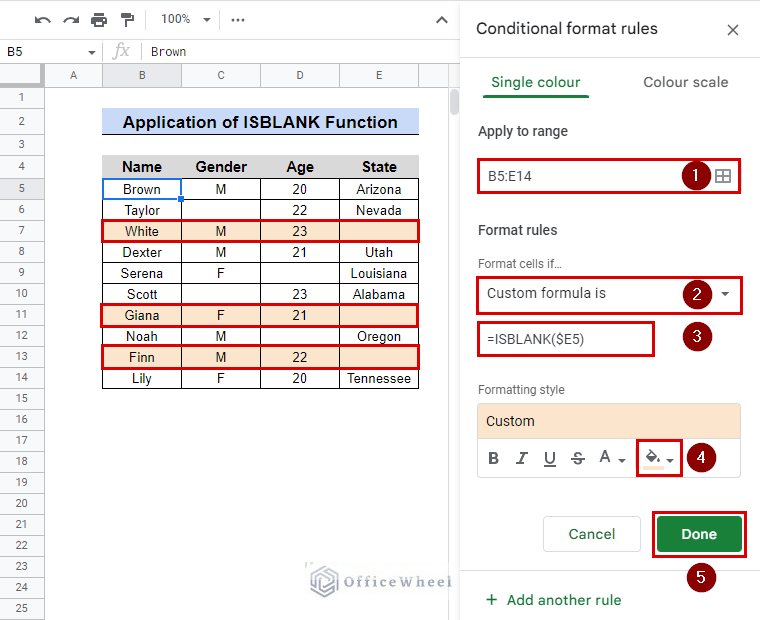
When working with larger databases, it might be difficult for human eyes to spot all the flaws or gaps. We can be a little bit smarter and lessen the ...
It takes a lot of time to interpret Google Sheets with too much data. One simple solution to this problem is highlighting the important information ...
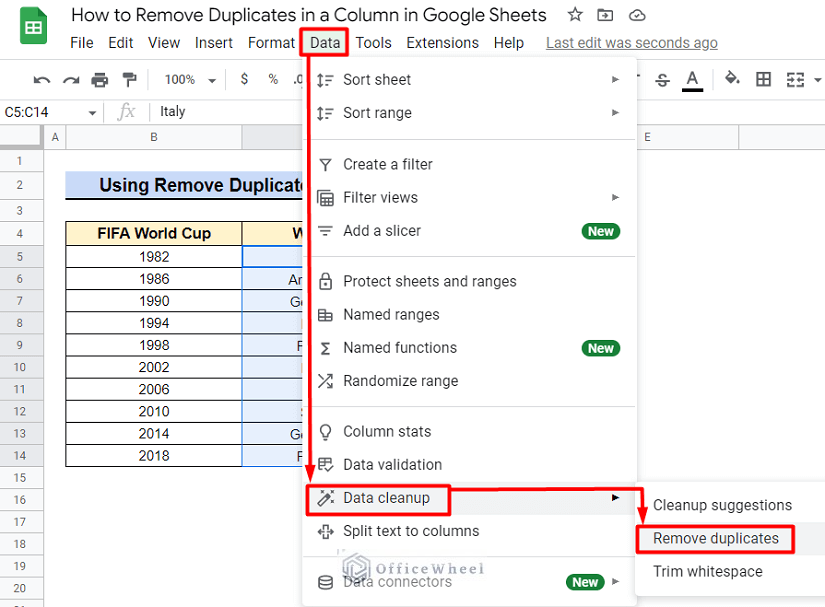
Assume you have obtained a raw dataset in Google Sheets. Each value in the dataset contains various extra characters after a specific character. Now ...
If you need to highlight row based on a date in Google Sheets then you have come just to the right place! In this article, we will discuss in detail ...