The quartiles are an excellent tool for analyzing statistical data. These merely provide us with the variance surrounding the median of the given data. After that, we may use mathematics to assess the reliability of our sample data. There are some built-in functions like the QUARTILE function in Google Sheets to calculate the quartiles. In this article, I’ll show 4 useful methods on how to find quartiles in Google Sheets with clear images and steps.
A Sample of Practice Spreadsheet
You can download Google Sheets from here and practice very quickly.
What Are Quartiles in Google Sheets?
The quartiles are the 3 distinct points of data values. The 3 points are the median value, the point between the minimum and median value, and the point between the median and maximum value of a dataset. The last 2 are called the first and second quartiles respectively. So in order to determine the quartiles of a data range we have to know the maximum and minimum values of the range also.
We generally perform quartile calculations to determine data deviations. There are many benefits to using quartiles in Google Sheets, whether it is doing business or studying statistics.
4 Useful Methods to Find Quartiles in Google Sheets
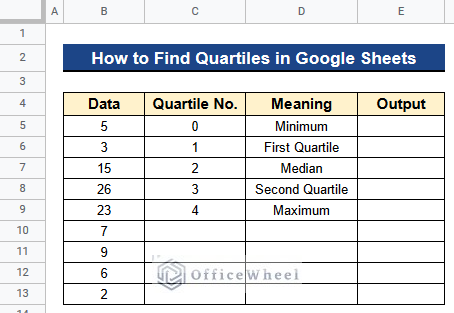
Let’s get introduced to our dataset first. Here we have some numerical values in Column B. We have inserted quartile no. in Column C and their meaning in Column D. Now we want to calculate the quartiles of our dataset. So, we’ll see 4 useful methods on how to find quartiles in Google Sheets by using this dataset.
1. Using QUARTILE Function
We can use the QUARTILE function to calculate quartiles in Google Sheets directly. But we have to know how this function works. First, we have to give the data range in this function. Then we have to give the quartile no. into the function. There are 5 quartile no. between 0 to 4 in the function which denotes different values. Below we’ll see which quartile no. denotes which values-
- 0 – returns the minimum value of the dataset,
- 1 – returns the first quartile of the dataset,
- 2 – returns the median of the dataset,
- 3 – returns the second quartile of the dataset, and
- 4 – returns the maximum value of the dataset.
Let’s see the steps of finding the quartiles by using this function.
Steps:
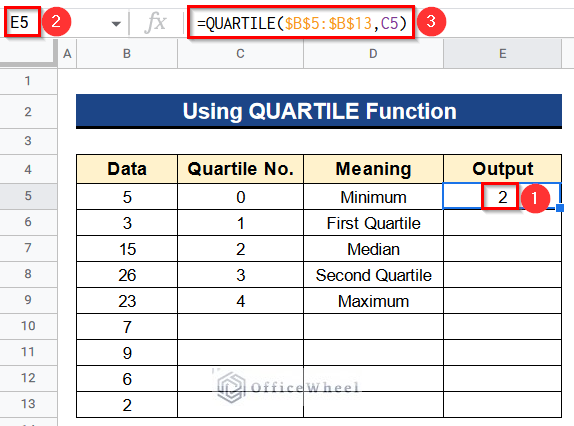
- Firstly, type the following formula in Cell E5–
=QUARTILE($B$5:$B$13,C5)- Secondly, hit Enter to get the minimum value of the dataset.
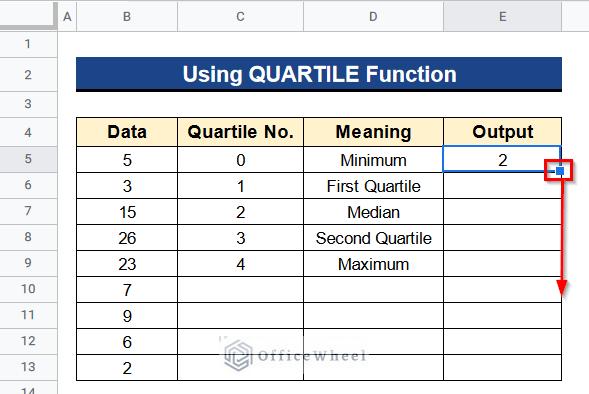
- Thirdly, apply the Fill Handle tool to use the formula in the rest of the cells of Column E.
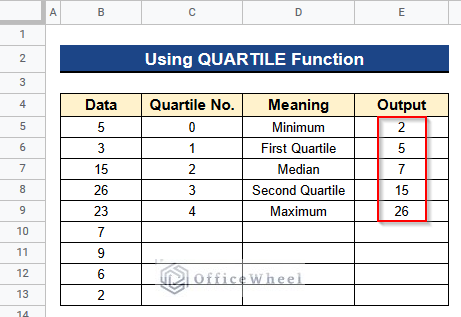
- Finally, you’ll get all 3 quartiles along with the minimum and maximum numbers in Column E.
Read More: How to Use Find and Replace in Column in Google Sheets
2. Applying QUARTILE.INC Function
You can also use the QUARTILE.INC function to find quartiles in Google Sheets. This function exactly works like same as the QUARTILE function. There is no difference. But if you want to use your Google Sheets across other platforms like Microsoft Excel then it is more convenient to use the QUARTILE.INC function. Below you’ll find the procedure.
Steps:
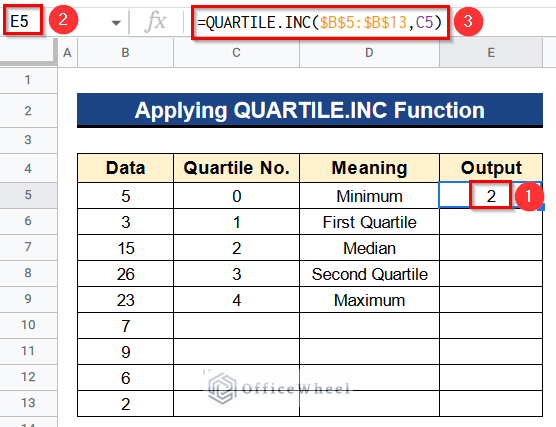
- At first, select Cell E5.
- Then, write the following formula there-
=QUARTILE.INC($B$5:$B$13,C5)- And, click the Enter button to get the minimum value.
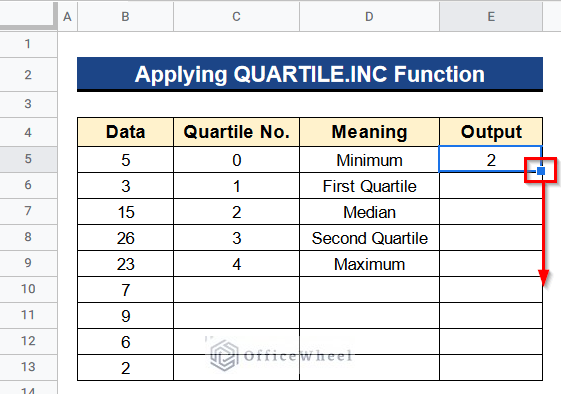
- Next, apply the Fill Handle tool to the remaining cells in Column E to utilize the formula there.
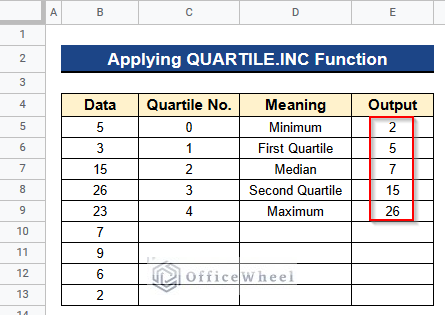
- In the end, all 3 quartiles will be present in Column E. There will also be the maximum and minimum values in Column E.
Similar Readings
- How to Find Edit History in Google Sheets (4 Simple Ways)
- Use FIND Function in Google Sheets (5 Useful Examples)
- How to Find and Delete in Google Sheets (An Easy Guide)
- Find and Replace with Wildcard in Google Sheets
- How to Remove Special Characters in Google Sheets (3 Easy Ways)
3. Assigning QUARTILE.EXC Function
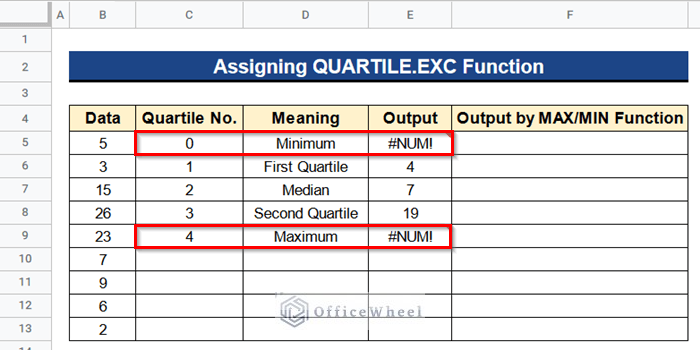
At this time there is another built-in function in Google Sheets that can determine the quartiles. That function is the QUARTILE.EXC function. But there is a problem with using this function. This function does not recognize quartiles no. 0 and 4, unlike the QUARTILE and QUARTILE.INC functions. So you can not determine the minimum and maximum values of your dataset by using the QUARTILE.EXC function. It’ll give an error message. Don’t worry, in this case, we’ll use the MIN and MAX functions to determine those minimum and maximum values.
Steps:
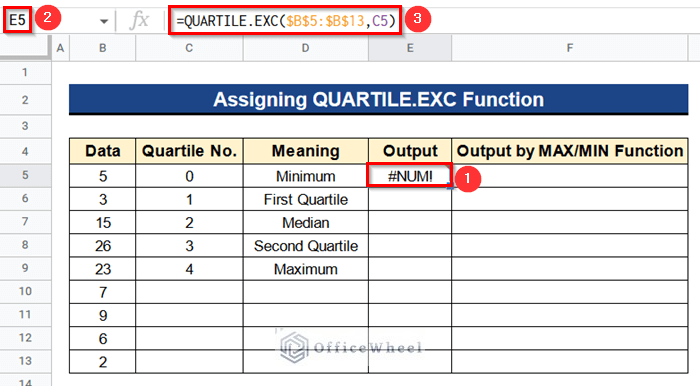
- First of all, put the next formula in Cell E5–
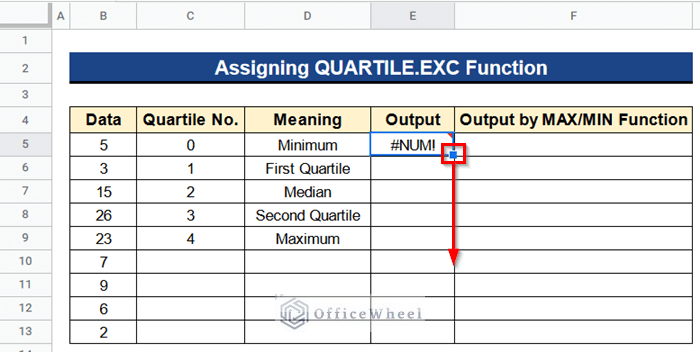
=QUARTILE.EXC($B$5:$B$13,C5)- Then, hit Enter and you’ll find a #NUM! error.
- The error is occurring because the QUARTILE.EXC function does not give results for the minimum value of the dataset. So we’ll use the MIN function here later to get the minimum value.
- Next, to utilize the formula in the remaining cells of Column E, use the Fill Handle tool.
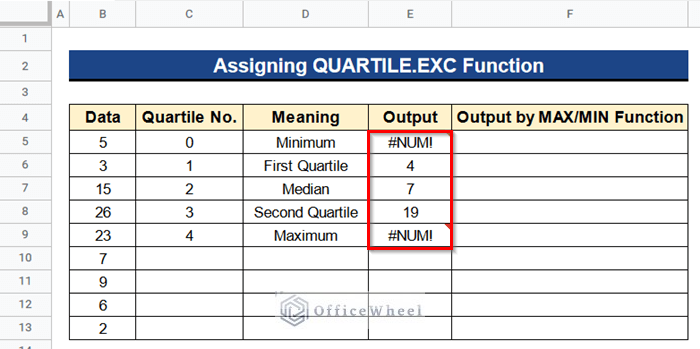
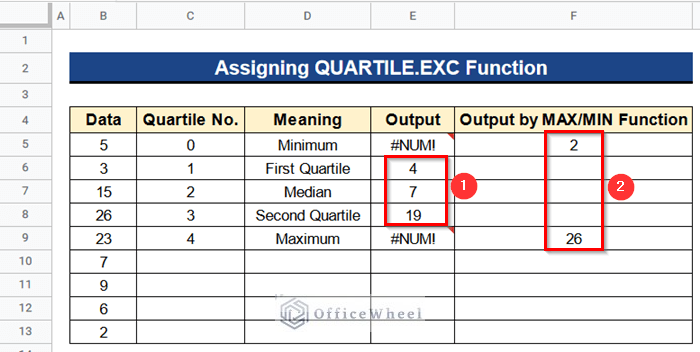
- Then, you’ll get all 3 quartiles in Column E. But the minimum and maximum numbers aren’t there.
- If you look closely you’ll see that it is giving #NUM! error for the minimum and maximum numbers. The QUARTILE.EXC function doesn’t produce results for the dataset’s minimum and maximum values. So we’ll use the MIN and MAX functions here.
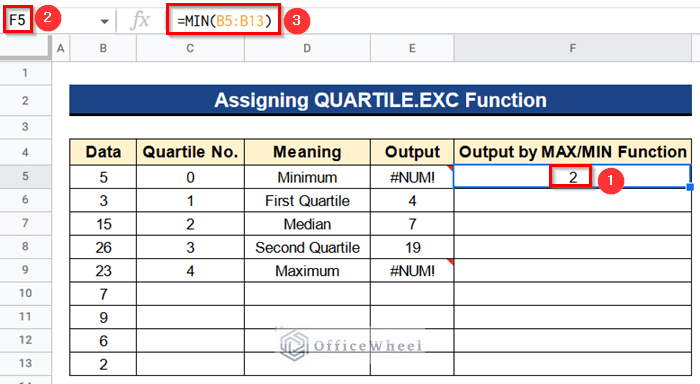
- Now, in Cell F5, enter the following formula-
=MIN(B5:B13)- Along with this, press the Enter button to find the minimum value.
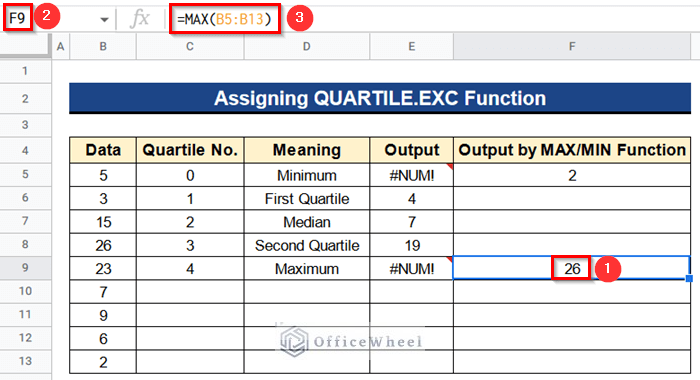
- Further, type the following formula in Cell F9–
=MAX(B5:B13)- Also, click the Enter button to get the maximum value.
- Ultimately, you’ll get 3 quartiles in Column E and the maximum and minimum numbers in Column F.
Read More: Easy Guide to Replace Formula with Value in Google Sheets
4. Using PERCENTILE Function
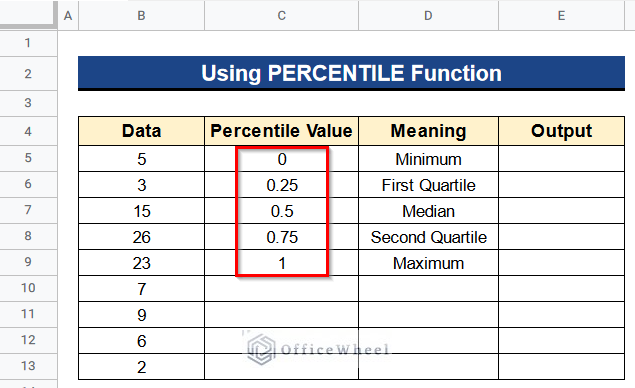
We can also use the PERCENTILE function to calculate quartiles in Google Sheets. Here we have to put the percentile value into our formula. The percentile value we have to insert is as below-
- 0 – for the minimum value because it is the 0th percentile of the dataset,
- 0.25 – for the first quartile because it is the 25th percentile of the dataset,
- 0.5 – for the median because it is the 50th percentile of the dataset,
- 0.75 – for the second quartile because it is the 75th percentile of the dataset, and
- 1 – for the maximum value because it is the 100th percentile of the dataset.
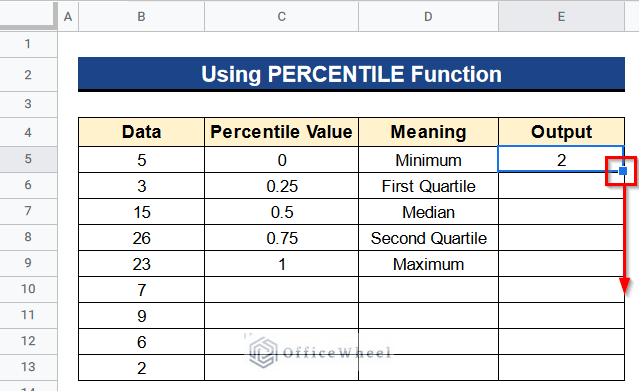
We have inserted these values in Column C of our dataset as you can see below. Inserting these percentile values into the PERCENTILE function will give the desired output quickly. Let’s see how to do it.
Steps:
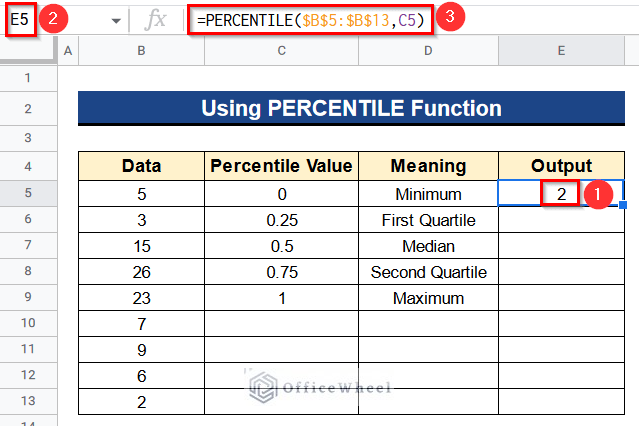
- Initially, we’ll write the following formula in Cell E5–
=PERCENTILE($B$5:$B$13,C5)- Subsequently, we press Enter to get the desired minimum value.
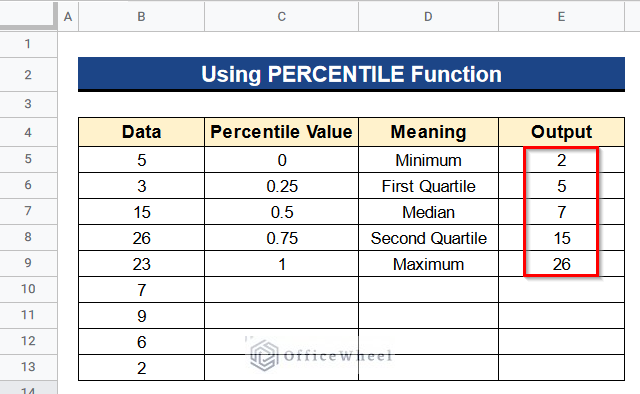
- Then, use the Fill Handle tool to apply the formula to the remaining cells in Column E.
- At last, Column E will contain all 3 quartiles. It also contains the maximum and minimum values of the dataset.
Read More: Find All Cells With Value in Google Sheets (An Easy Guide)
Conclusion
That’s all for now. Thank you for reading this article. In this article, I have discussed 4 useful methods to find quartiles in Google Sheets. Please comment in the comment section if you have any queries about this article. You will also find different articles related to google sheets on our officewheel.com. Visit the site and explore more.
Related Articles
- How to Find Median in Google Sheets (2 Easy Ways)
- Find Hidden Rows in Google Sheets (2 Simple Ways)
- How to Find Slope of Graph in Google Sheets (With Easy Steps)
- Find Uncertainty of Slope in Google Sheets (3 Quick Steps)
- How to Find Linear Regression in Google Sheets (3 Methods)
- Find Frequency in Google Sheets (2 Easy Methods)
- How to Find Slope of Trendline in Google Sheets (4 Simple Ways)

