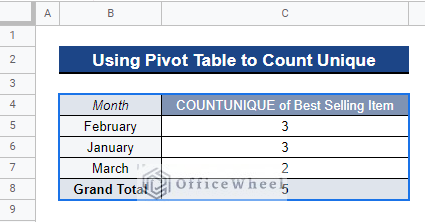
When dealing with large datasets in Google Sheets, duplicate values are commonly encountered. You might occasionally decide to focus just on the unique values in the dataset. It takes a lot of time to manually locate unique data. To locate unique values quickly, we can use Google Sheets’ features or functions. We can even use a pivot table to count the unique values in our dataset. In this article, I’ll demonstrate the step-by-step process of using a pivot table to count unique values in Google Sheets. Here is an overview of what we will achieve:
Step-by-Step Process to Use Pivot Table to Count Unique Values in Google Sheets
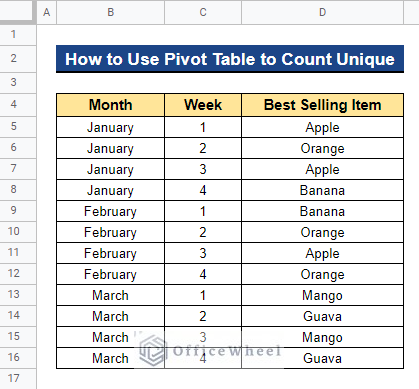
We will use the dataset below to demonstrate the step-by-step process of using a pivot table to count unique values in Google Sheets. The database contains the top-selling items from a certain retailer for each week and month. We’ll now make a pivot table and count the unique values of the best-selling items for each month.
Step 1. Create a Pivot Table
Firstly, we have to create a pivot table to summarize our dataset and count the unique values of the best-selling items for each month. To do so, follow the steps below-
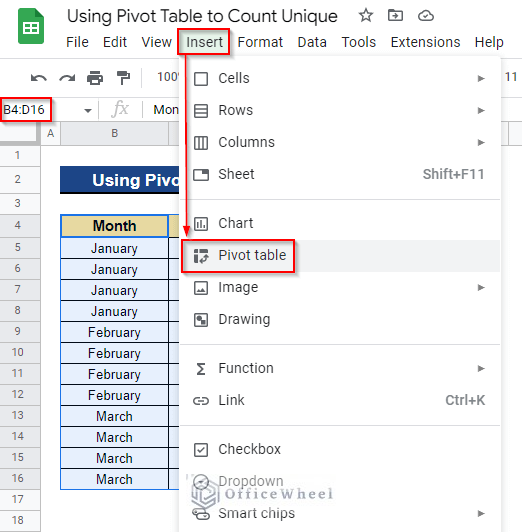
- Firstly, select the entire dataset to create a pivot table. In our case, we selected Cell B4:D16. Next, go to the Insert tab from the top menu bar and select Pivot table.
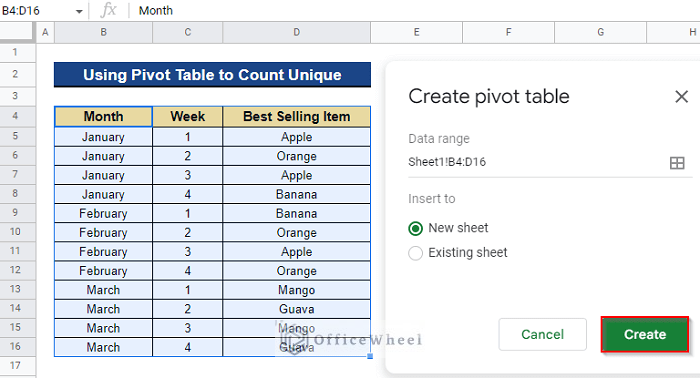
- As a result, a dialog box named Create pivot table will appear. It will ask you whether you want to insert the pivot table into a new sheet or the existing sheet. In this case, we choose the New sheet option. Now, click on the Create option to create the pivot table.
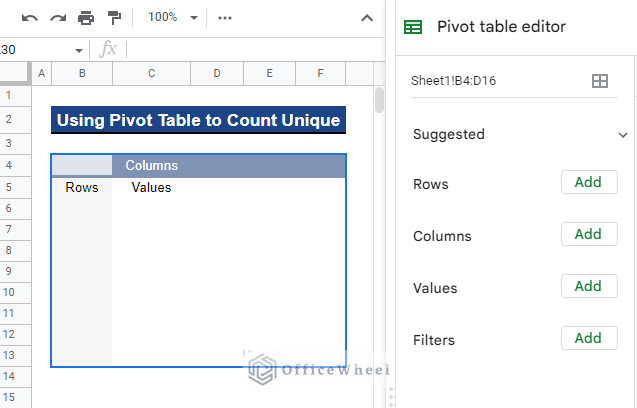
- Thus, it will create a pivot table to a new sheet for your dataset.
Read More: How to Get Unique Values Without Blanks in Google Sheets
Step 2. Add Rows
Now, you have to add rows to the pivot table to count the unique values across the rows. We want to count the unique values of the best-selling items for each month. So we have to add months as rows for our pivot table.
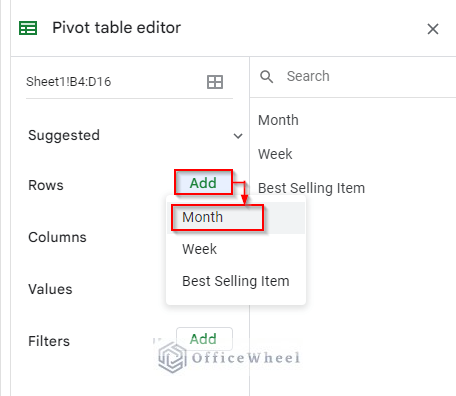
- Firstly, click on the Add option next to the Rows section and choose Month.
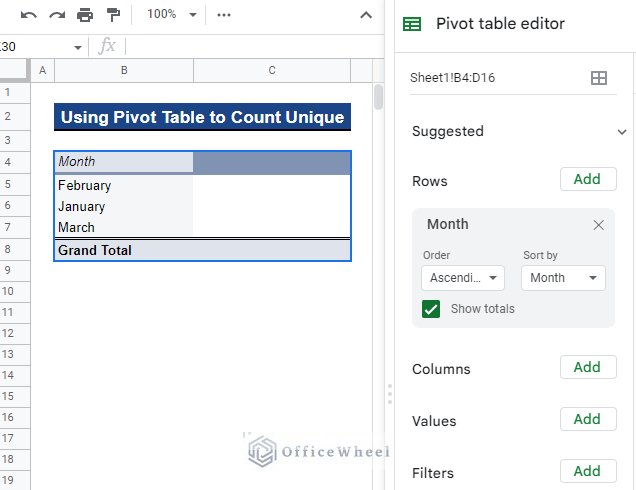
- As a result, it will add every month of our dataset as a row of the pivot table.
Read More: How to Filter Unique Rows in Google Sheets (4 Easy Ways)
Step 3. Add Values
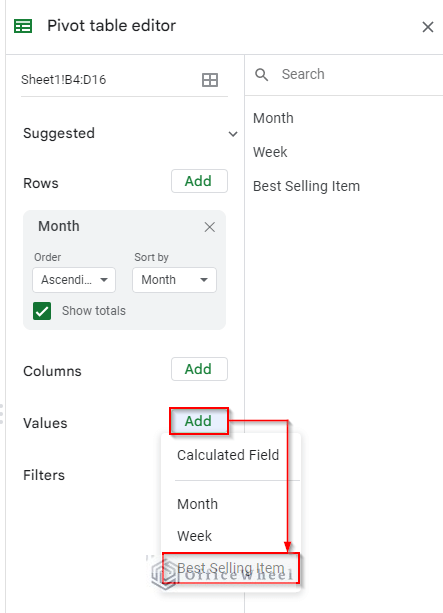
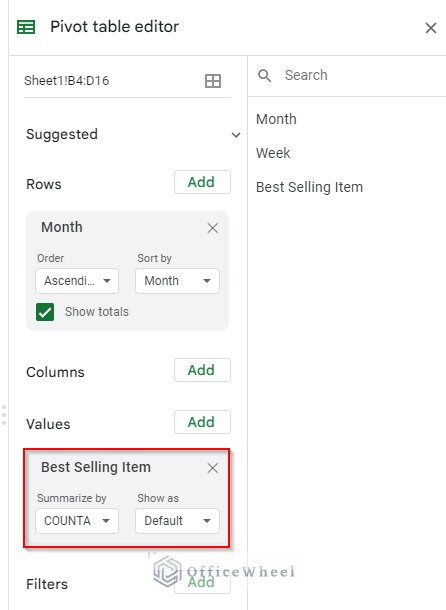
Next, we have to add Values to the pivot table. As we want to count the unique values of the best-selling product, we have to add the Best Selling Item column as values for our pivot table.
- First, click on the Add option next to the Values section and choose Best Selling Item.
- Thus, it will add the Best Selling Item as Values of our pivot table.
Read More: How to Filter Unique Values in Google Sheets (5 Simple Ways)
Step 4. Inserting COUNTUNIQUE Function
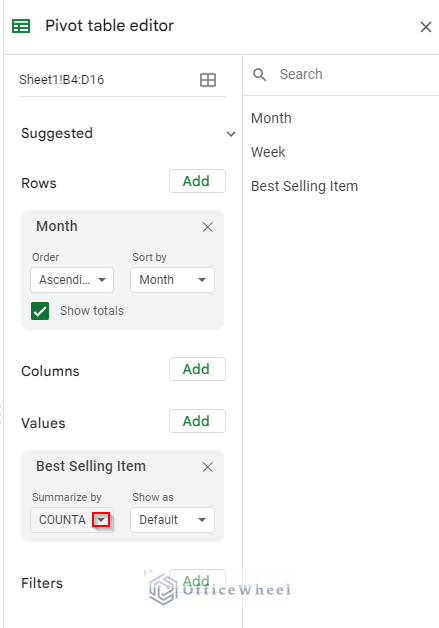
Finally, we have to use a function to count the unique values. Here, we’ll use the COUNTUNIQUE function to count the unique values of the best-selling items for each month.
- First, click on the drop-down icon under Summarize by section of the Best Selling Item field.
- Next, choose COUNTUNIQUE from the list.
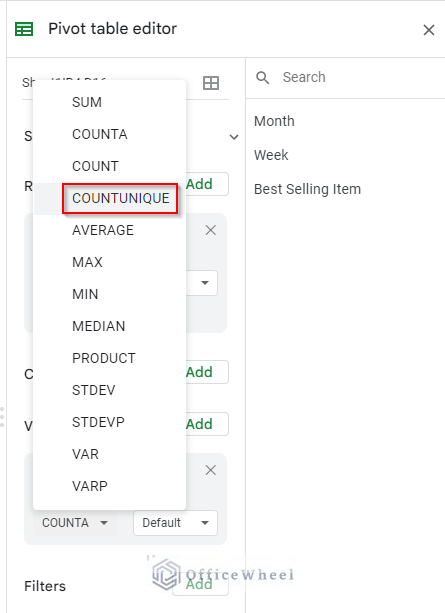
- As a result, it will count the unique values of best-selling products for every month.
Read More: Use COUNTIF Function to Count Unique Values in Google Sheets
Conclusion
This brings up the end of our article. In this article, I’ve covered the step-by-step process of using a pivot table to count the unique values in Google Sheets. I hope this will help you to count unique values using a pivot table in Google Sheets. Please feel free to comment with any queries or suggestions in the comment section below. Visit our site Officewheel.com to explore more.