In Google Sheets, you might regularly want to count the number of unique values in a large set of data. It makes no sense to count them individually or manually, especially when significantly more user-friendly Google Sheets tools are available. They are straightforward yet important functions to be aware of because they will expedite the process of counting unique values. In this article, I will show 4 easy ways to count unique values in multiple columns in Google Sheets.
4 Easy Ways to Count Unique Values in Multiple Columns in Google Sheets
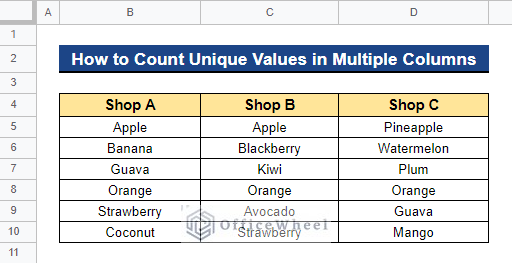
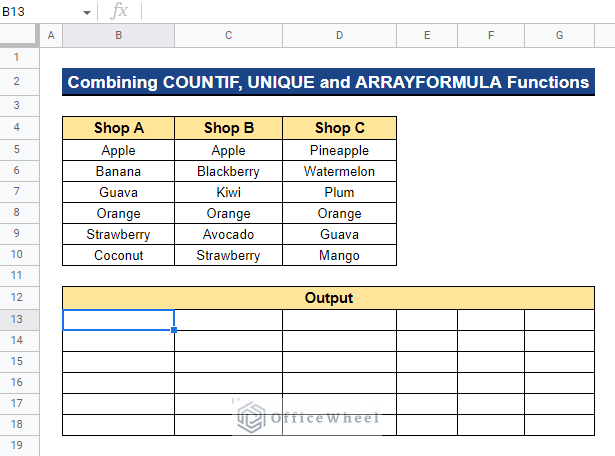
We will use the dataset below to demonstrate 4 easy ways to count unique values in multiple columns in Google Sheets. The dataset contains the product names from three separate stores. We will now count the number of unique values in the dataset. Following that, we will also check how frequently each product appears across the entire dataset.
1. Using COUNTUNIQUE Function
To count unique values in Google Sheets inside a specific range of data, we can use a built-in function in Google Sheets. The COUNTUNIQUE function can count the number of unique values in a single column or multiple columns in Google Sheets.
Steps:
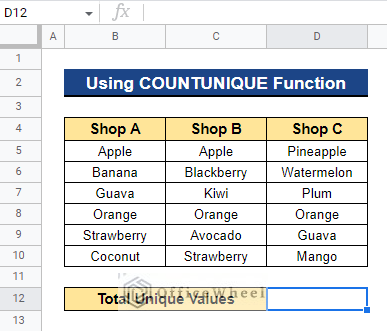
- Firstly, select a cell where you want to apply the formula. In our case, we selected Cell D12.
- Now, type the formula below and press Enter–
=COUNTUNIQUE(B5:D10)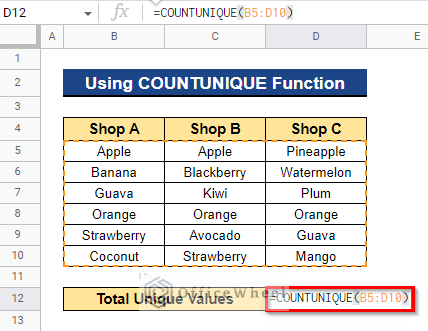
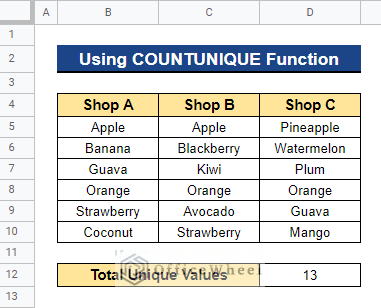
- Thus, it will display the total number of unique values across the data range.
Read More: How to Use Pivot Table to Count Unique Values in Google Sheets
2. Combining COUNTIF, UNIQUE, and ARRAYFORMULA Functions
In Google Sheets, there are occasions when we’d like to see all the unique values in a range and count how many times they appear there. You can accomplish this by combining the COUNTIF, UNIQUE, and ARRAYFORMULA functions.
Steps:
- Firstly, choose a cell to which you want to apply the formula and display the results. In our case, we chose Cell B13.
- Now, input the formula below and hit Enter–
={UNIQUE(B5:D10),ARRAYFORMULA(COUNTIF(B5:D10,UNIQUE(B5:D10)))}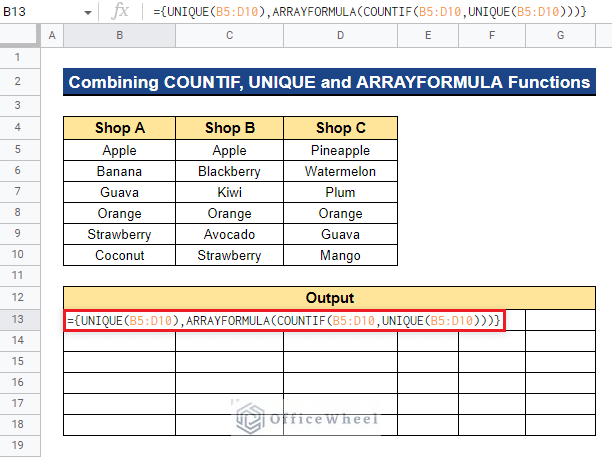
Formula Breakdown
- UNIQUE(B5:D10)
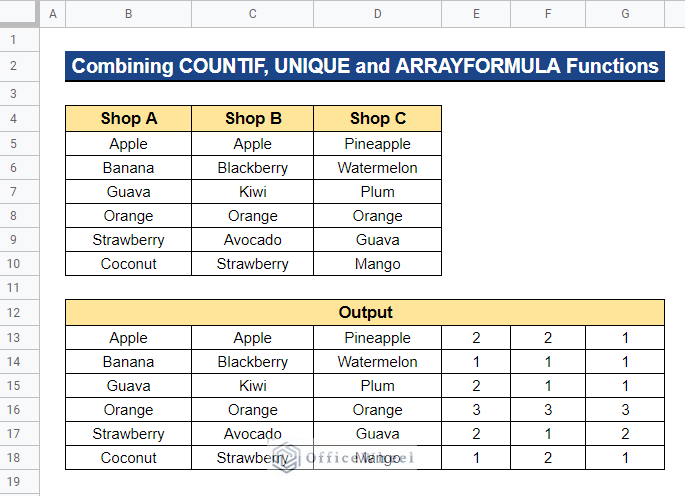
Firstly, the UNIQUE function will return all the unique values across the data range.
- ARRAYFORMULA(COUNTIF(B5:D10,UNIQUE(B5:D10)))
Then, it will return the occurrences of each of the unique values.
- {UNIQUE(B5:D10),ARRAYFORMULA(COUNTIF(B5:D10,UNIQUE(B5:D10)))}
Here, the curly braces {} are used to combine both results.
- Thus, you will get the corresponding occurrences of each product in the dataset.
Read More: Use COUNTIF Function to Count Unique Values in Google Sheets
3. Applying UNIQUE Function
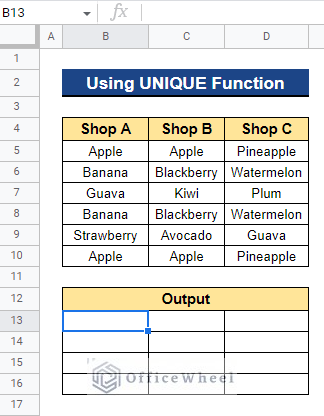
We can use the UNIQUE function to see the total number of unique values in the dataset. This technique can be used to find distinct values within a single column or to find full-row duplication within several columns.
Steps:
- To begin, select a cell to which you want to apply the formula. We selected Cell B13.
- Now, enter the following formula and press the Enter button-
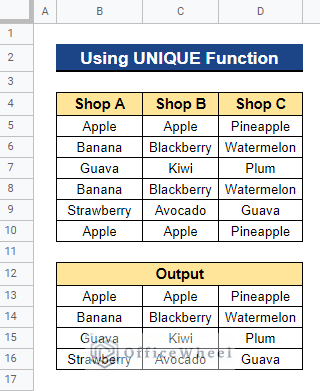
=UNIQUE(B5:D10)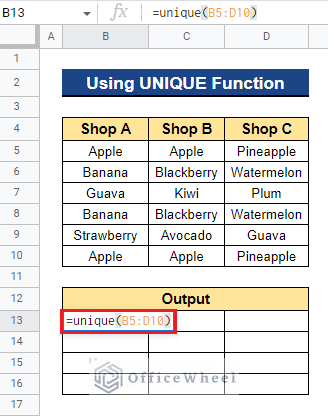
- Thus, it will remove all the complete row duplicates across multiple columns.
Read More: How to Get Unique Values Without Blanks in Google Sheets
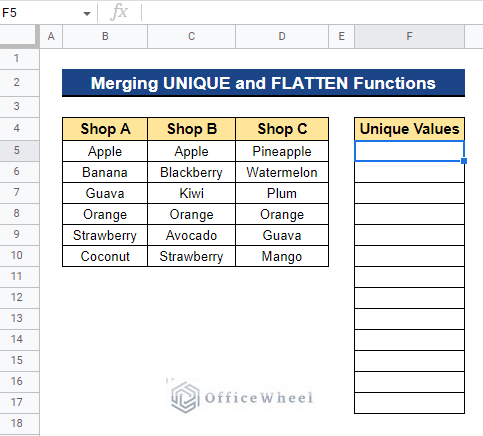
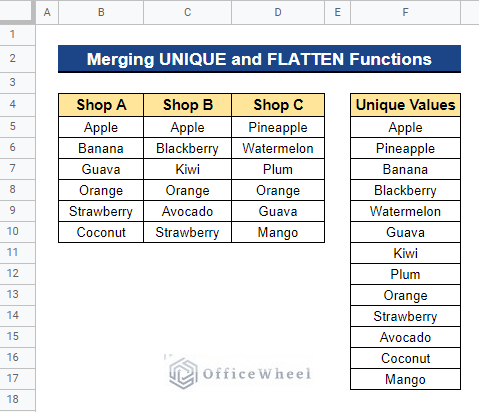
4. Merging UNIQUE and FLATTEN Functions
Only whole row duplication will be eliminated when we utilize the UNIQUE function with the FLATTEN function. It will extract the unique values in a list from multiple columns in Google Sheets.
Steps:
- Firstly, select the cell to which you’d want to apply the formula and view the results. In our situation, we choose Cell F5.
- Now, input the formula below and press the Enter key-
=UNIQUE(FLATTEN(B5:D10))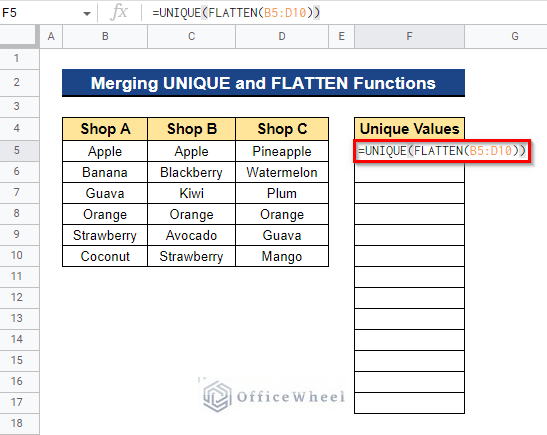
Formula Breakdown
- FLATTEN(B5:D10)
Firstly, the FLATTEN function will return all the values from the data range into a single column.
- UNIQUE(FLATTEN(B5:D10))
Then, the UNIQUE function will detect the unique values across that column.
- Thus, you will get all the unique values across the columns.
Conclusion
In this article, I have shown 4 easy ways to count unique values in multiple columns in Google Sheets. After reading this article, you can obtain the total number of unique values, the names of each unique value, and the frequency with which they occur. Please feel free to post any questions or suggestions in the comment section below. Visit Officewheel.com to explore more.
Related Articles
- How to Filter Unique Values in Google Sheets (5 Simple Ways)
- Filter Unique Rows in Google Sheets (4 Easy Ways)
- How to Find Unique Values in Google Sheets (5 Simple Ways)
- Apply QUERY for Unique Rows in Google Sheets (4 Ways)
- How to Highlight Unique Values in Google Sheets (9 Useful Ways)
- Remove Unique Values in Google Sheets (2 Suitable Ways)