The pivot table is one of the most powerful tools available in a spreadsheet application. Used primarily to summarize data, pivot tables have become a staple skill to have for any user.
Thus, we have created this comprehensive guide for you, users new and old, to show you how to make a pivot table in Google Sheets.
What is a Pivot Table?
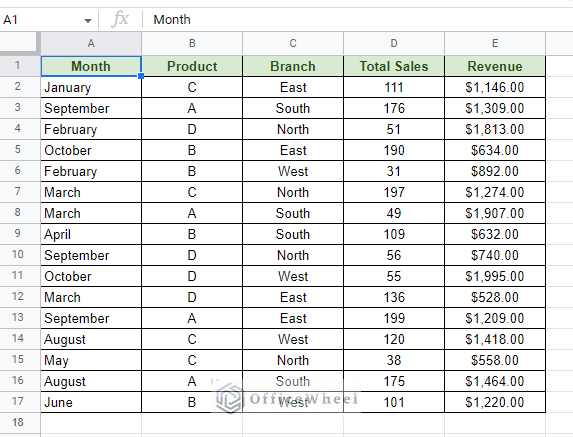
When you think about it, a spreadsheet is fundamentally a set of rows and columns that contain data. Thanks to this simple layout, it is easy to input and decipher data from it.
But things aren’t always that simple.
There are multiple types of data that a spreadsheet can have, let alone have a near infinite potential of having relationships with other columns of data.
Thus, to summarize this data and answer a lot of the user’s questions about this dataset we have the Pivot Table.
The pivot table is a tool that summarizes a large set of data for the purpose of easy analysis.
There are a couple of unspoken requirements that are needed to create a pivot table in Google Sheets:
1. An organized set of data.
It goes without saying, but if your data is not organized properly, not even using a pivot table will help you decipher it.
Remember: A pivot table simply summarizes a spreadsheet to make it easier to decipher for its users.
2. A clear objective
Most users underestimate the power of having a clear question in mind. If you do not ask the right questions, you won’t be able to get the right answers. With pivot tables being so customizable in Google Sheets, having a clear objective is crucial.
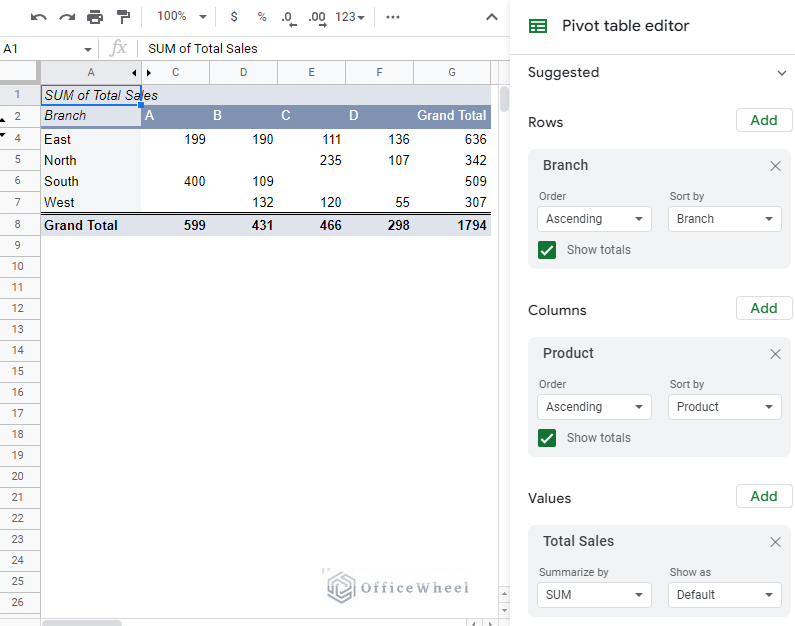
The above image shows a pivot table that presents the total sales of each product by region.
How to Make a Pivot Table in Google Sheets Step by Step
To a new user, especially those coming from other applications like Excel, pivot tables may seem different or difficult. Though the truth is that it is anything but.
We’d even argue that pivot tables in Google Sheets are the easiest to work with, mainly thanks to its active updates based on user feedback.
This brings us to the topic of creating a pivot table in Google Sheets, which can be summarized in a few simple steps:
- Select the cells containing data.
- Click Insert > Pivot table
- Generate the pivot table in the current worksheet or a different worksheet.
- Set row, column, value, and other conditions to present in the pivot table.
- Edit the table to make it more presentable (optional).
And we are done!
The rest of the article contains a detailed tutorial of all the steps needed to create and work with pivot tables in Google Sheets using practical dummy data.
Steps to Create and Use a Pivot Table in Google Sheets
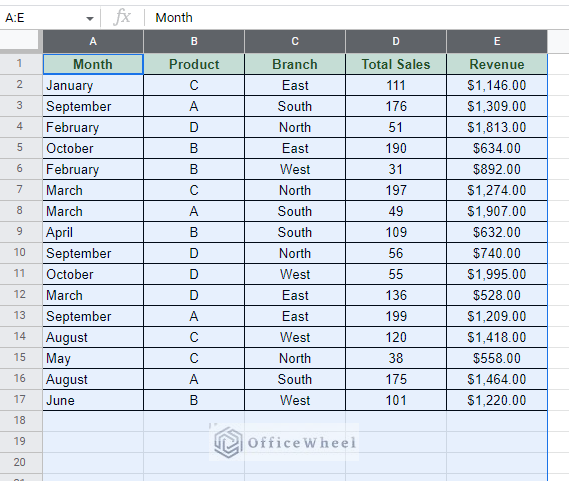
Step 1: Select the cells of the dataset. Here we will select the entire column so that when new data is entered that data is automatically updated in the pivot table.
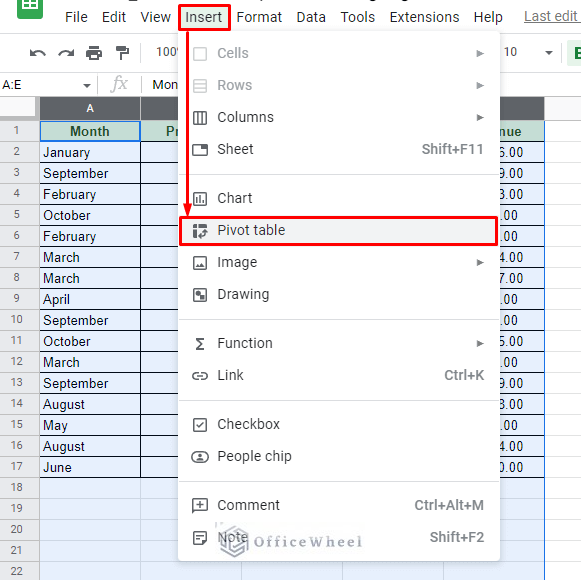
Step 2: Navigate to the Pivot table option from the Insert tab.
Insert > Pivot table
Step 3: You’ll be given an option to select where you want to generate the pivot table:
- New sheet
- Existing sheet
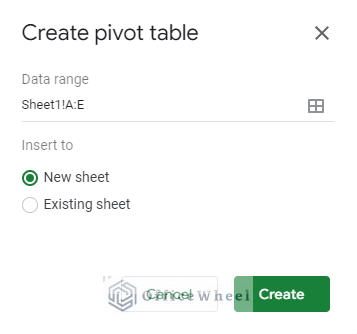
We’ve chosen to opt for the ‘New sheet’ option.
Step 4: Click Create to generate a pivot table in Google Sheets. Initially, however, you will get a bare-bones structure as you can see in the image below:
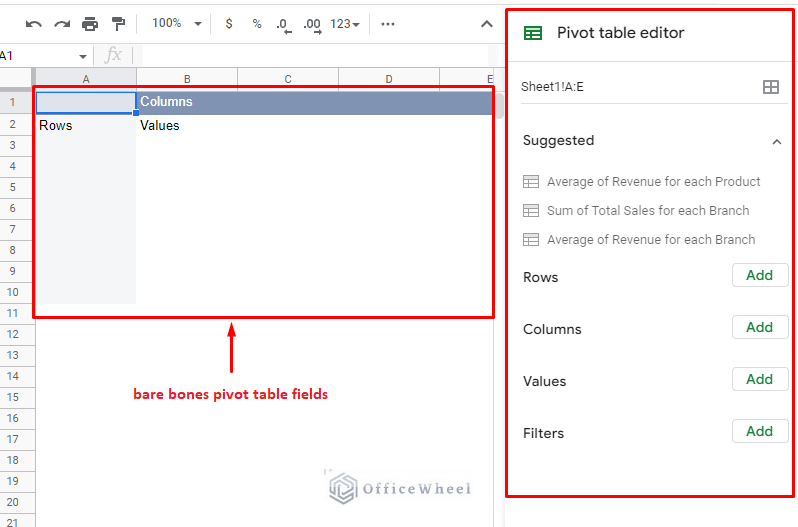
It is in the Pivot table editor where the user can customize these fields according to their requirements.
Step 5 (Optional): As you may notice, there is a section in the editor called Suggested. These contain automatically generated ideas for pivot tables based on the source data. That’s Google’s AI at work.
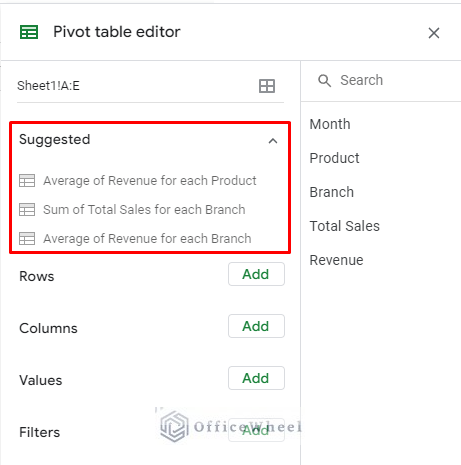
If your objective for the pivot table is listed there, feel free to apply:
Step 5: But most likely a user’s requirement for a pivot table will be more objective-oriented, as we mentioned before.
Let’s say we want a pivot table to present the total sales by product type and region (Branch).
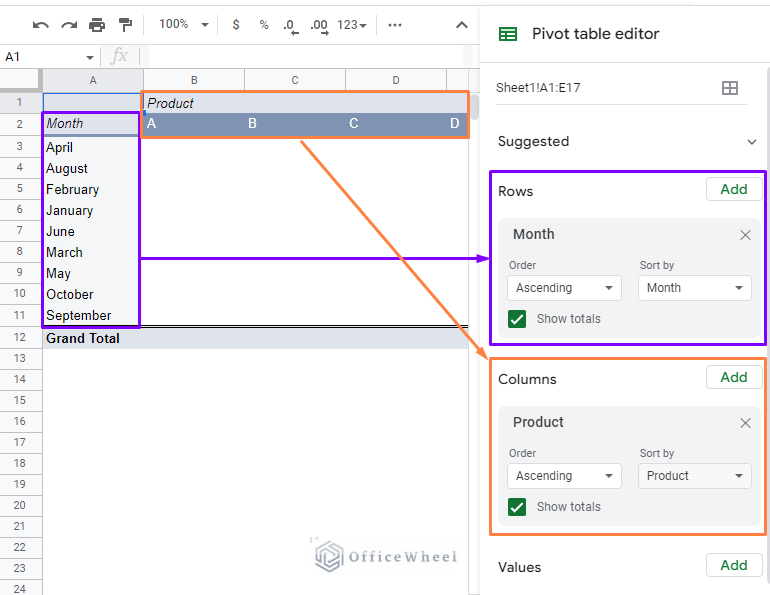
The first thing we need to do is set the headers. Let the row headers be ‘Month’ and Column headers be ‘Product’.
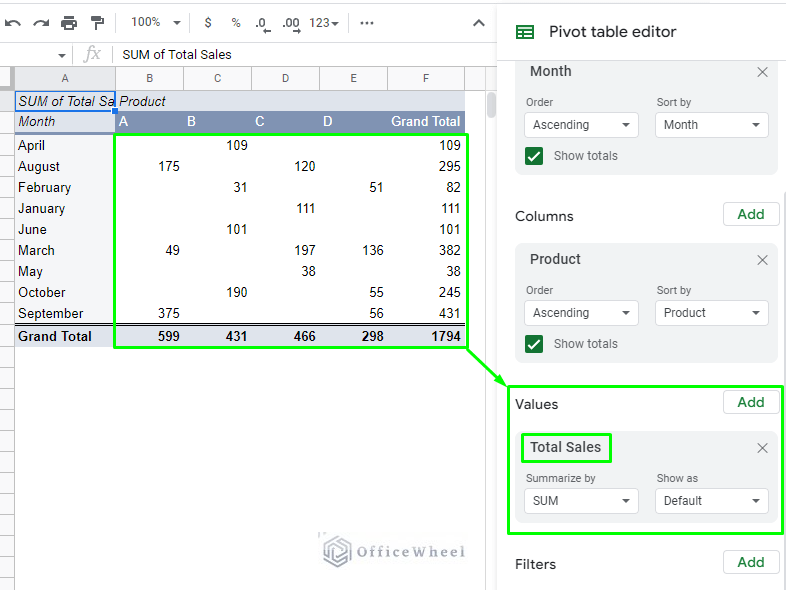
Step 6: Populate the pivot table with values. The Value section of the editor will let you choose the type of value that we want to get from this table. We’ve chosen to present the sum of Total Sales as the values.
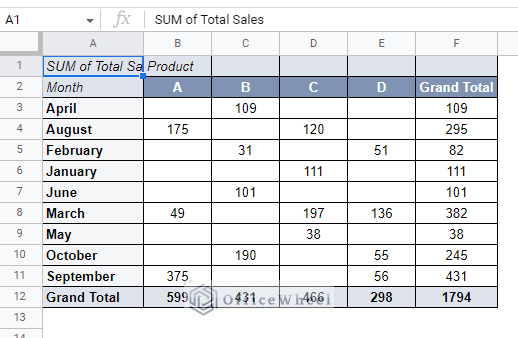
Step 7: With a little bit of formatting of the pivot table, we get the final version:
How to Read a Pivot Table
Even with the pivot table generated, we can do so much more to organize the data. This is thanks to all of these we have available fields in the Pivot table editor:
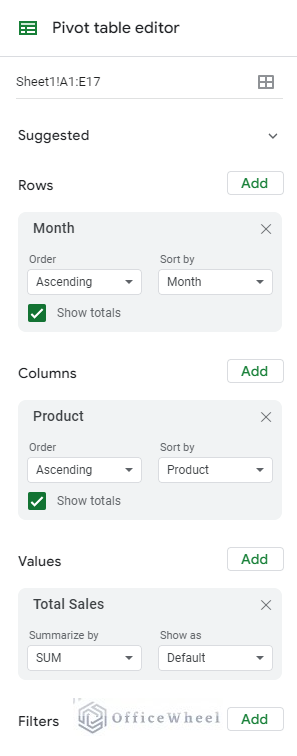
We can sort, filter, or arrange the data in any way we want using these options.
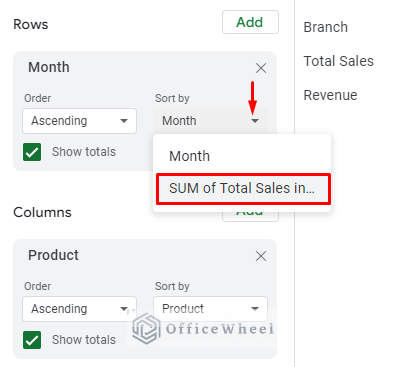
For example, let’s say we want to sort the pivot table data according to the total sales of each month to find the months with the highest sales.
All we must do is move to the Rows section and Sort by the SUM of Total Sales instead of Months. The reference column will be Grand Total
Rows > Sort by > SUM of Total Sales > Grand Total
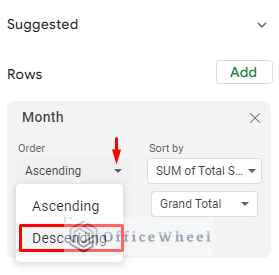
For the final touches, set the Order to Ascending to Descending to put the highest sales on top.
Order > Descending
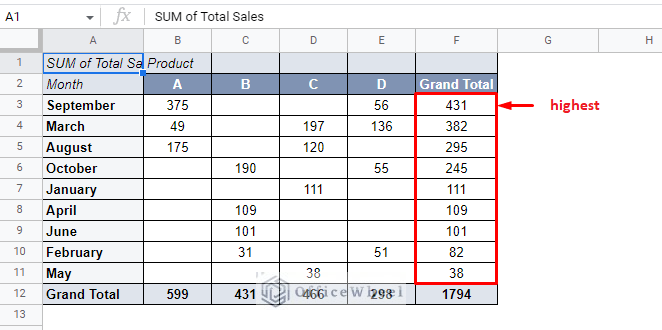
The result:
Learn More: How to Sort a Pivot Table in Google Sheets (An Easy Guide)
Again, this but one of the many ways you can arrange your pivot table to better present the data to analyze and answer questions.
The Pros and Cons of Pivot Tables in Google Sheets
Pros:
1. Pivot tables are easy to create. Google Sheets has made it quite easy to create and customize pivot tables. This is mostly thanks to its easy access and intuitive design of the UI of the Pivot table editor.
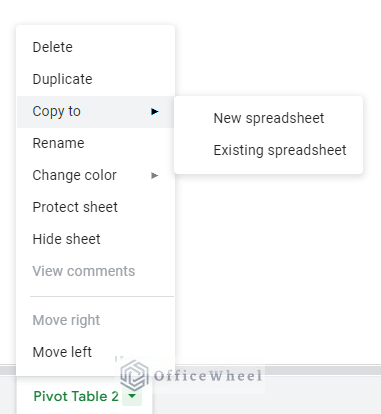
2. Pivot tables are easy to share. Once a pivot table is created you can easily copy or duplicate the table from the worksheet name tab located at the bottom of the window. Google Sheets also has an easy ‘Share’ button on the top-right of the window.
3. Pivot tables help make sense of data. Large sets of data can always be misinterpreted as human error will always be a factor. Pivot tables help summarize these data into bite-sized pieces that can be used for quick and efficient analysis.
Cons:
1. Pivot tables are hard to master. As easy as it is to make a pivot table in Google Sheets, most users can get overwhelmed by the sheer number of customizations they can do in the editor. Not to mention, the learning curve to know where what is and what they do to properly present the data that they want.
2. No mobile support. As of writing this article, Google Sheets does not provide any way to create pivot tables in the mobile version of the application.
Final Words
Pivot tables are a great way to summarize, analyze and derive answers from a large dataset in any spreadsheet application. This makes learning to create a pivot table crucial to further your data organization and analysis skills.
We hope that our simple, yet comprehensive guide has helped you understand the potential of pivot tables.
Related Articles for Reading
- How to Filter with Custom Formula in a Pivot Table of Google Sheets
- Google Sheets: Create a Pivot Table with Data from Multiple Sheets
- How to Refresh a Pivot Table in Google Sheets (3 Ways)
- Apply a Pivot Table Slicer in Google Sheets (An Easy Guide)
- Google Sheets Pivot Table: How to Remove Grand Total or Subtotal