Standard deviation is a famous statistical tool in Google Sheets that we use often to measure the spread of values from the actual average values. We also use the standard deviation of weighted variables in Google Sheets to measure the spread when weights are given against different values. In this article, we’ll see 2 suitable methods to calculate the standard deviation of weighted variables in Google Sheets with clear images and steps.
A Sample of Practice Spreadsheet
You can download Google Sheets from here and practice very quickly.
What Is Standard Deviation of Weighted Variables?
Standard deviation is a statistical tool that calculates the average distance of each value from the average of the whole dataset. And the standard deviation of weighted variables calculates the spread of values from the average of the whole dataset where some values have more weight than others.
2 Suitable Methods to Calculate Standard Deviation of Weighted Variables in Google Sheets
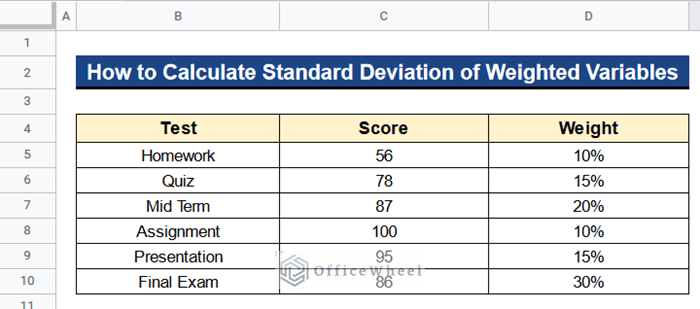
Let’s get introduced to our dataset first. Here we have some tests of a student in Column B and his scores in those tests in Column C. There are also some weights given on each test in Column D. Now, I’ll show you 2 suitable methods to calculate the standard deviation of weighted variables in Google Sheets with the help of this dataset.
1. Combining SUMPRODUCT, SUM and SQRT Functions
Firstly, we can combine the SUMPRODUCT, SUM and SQRT functions to calculate the standard deviation of weighted variables in Google Sheets. The SUMPRODUCT and SUM functions will help us to calculate the weighted average. We’ll also use the COUNTIF function to count the total number of non-zero weights. At last, the SQRT functions will give us the square root of the output and thus we get the desired standard deviation of weighted variables. Let’s see the steps.
Steps:
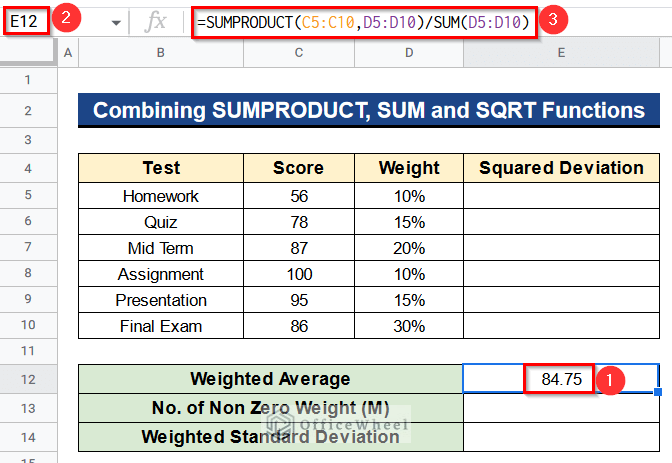
- At first, type the following formula in Cell E12–
=SUMPRODUCT(C5:C10,D5:D10)/SUM(D5:D10)- Then, hit Enter to get the weighted average.
Formula Breakdown
- SUMPRODUCT(C5:C10,D5:D10)
Initially, this function multiplies Cell C5 with Cell D5 and continues this till Cells C10 and D10. After that, it returns the summation of all the multiplied values.
- SUM(D5:D10)
This function returns the summation of the Cells from D5 to D10.
- SUMPRODUCT(C5:C10,D5:D10)/SUM(D5:D10)
At last, this formula gives the desired weighted average.
- Next, write the following formula in Cell E5–
=(C5-$E$12)^2- After that, press Enter to get the squared deviation.

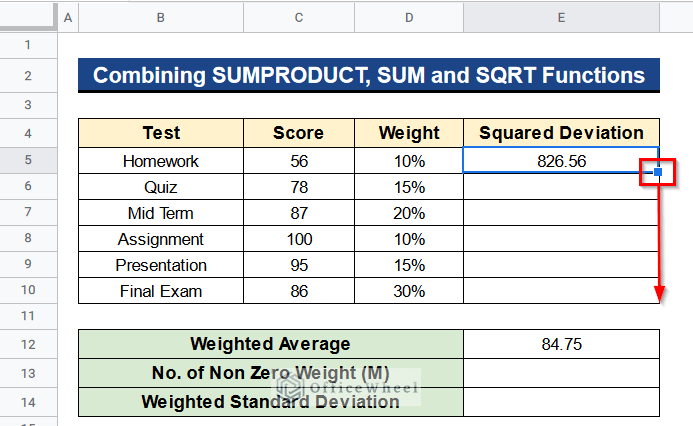
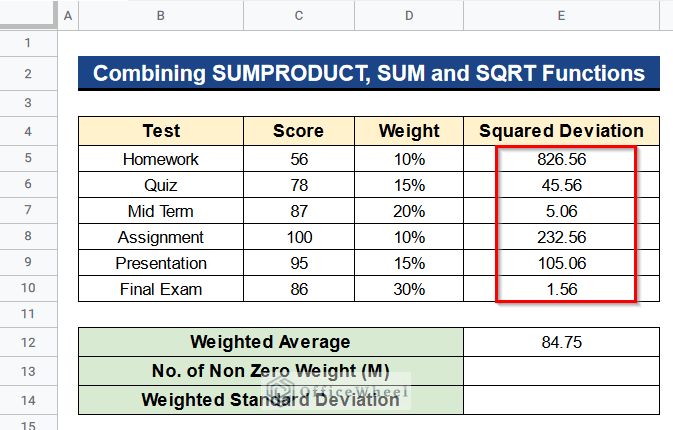
- Afterward, you’ll see the squared deviation for all the values in Column E.
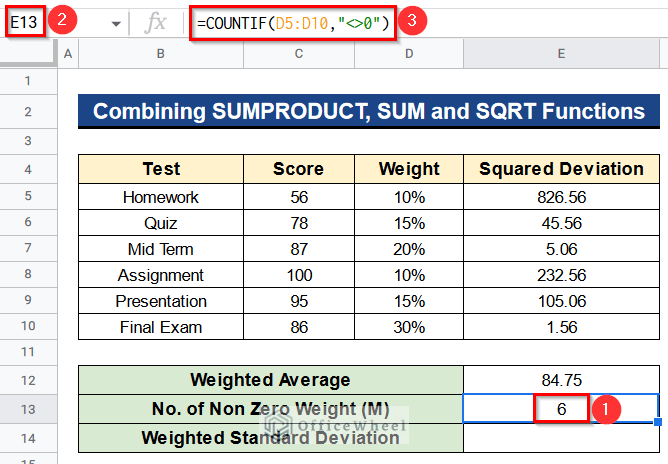
- Consequently, insert the following formula in Cell E13–
=COUNTIF(D5:D10,"<>0")- Again, click Enter to get the total numbers of non-zero weight (M).
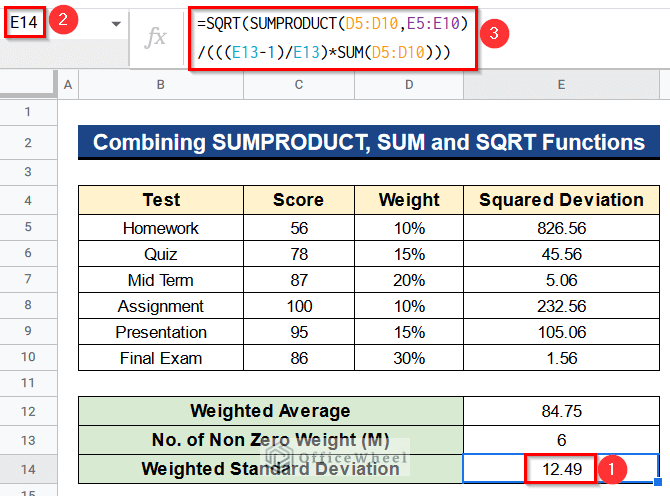
- Moreover, put the following formula in Cell E14–
=SQRT(SUMPRODUCT(D5:D10,E5:E10)/(((E13-1)/E13)*SUM(D5:D10)))- Finally, hit the Enter button to get the standard deviation of weighted variables.
Formula Breakdown
- SUMPRODUCT(D5:D10,E5:E10)
Before all, this function multiplies Cell D5 with Cell E5 and continues this until Cells D10 and E10. Then, it gives the summation of all the multiplied values.
- ((E13-1)/E13)*SUM(D5:D10)
Next, we subtract 1 from Cell E13 and divide it by Cell E13. Consequently, we multiply the output with the summation of the values from Cell D5 to D10.
- SQRT(SUMPRODUCT(D5:D10,E5:E10)/(((E13-1)/E13)*SUM(D5:D10)))
In the end, this formula gives the desired standard deviation of weighted variables.
Read More: How to Calculate Standard Deviation in Google Sheets
2. Uniting AVERAGE.WEIGHTED and SQRT Functions
Unlike, the previous method we can also unite the AVERAGE.WEIGHTED and SQRT functions to calculate the standard deviation of weighted variables in Google Sheets. The AVERAGE.WEIGHTED function is a built-in function in Google Sheets that serves the purpose of the combination of the SUMPRODUCT and SUM functions. That’s why in this case we’ll get the output quickly. Moreover, the COUNTIF function is also used like the previous method to count the total number of non-zero weights.
Steps:
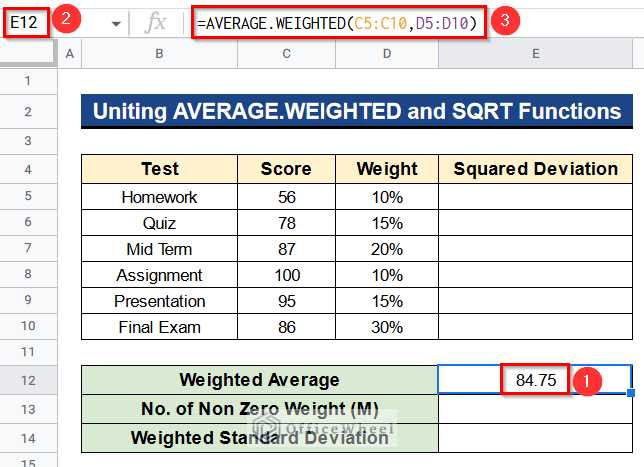
- First of all, insert the following formula in Cell E12–
=AVERAGE.WEIGHTED(C5:C10,D5:D10)- Also, press the Enter button to get the weighted average.
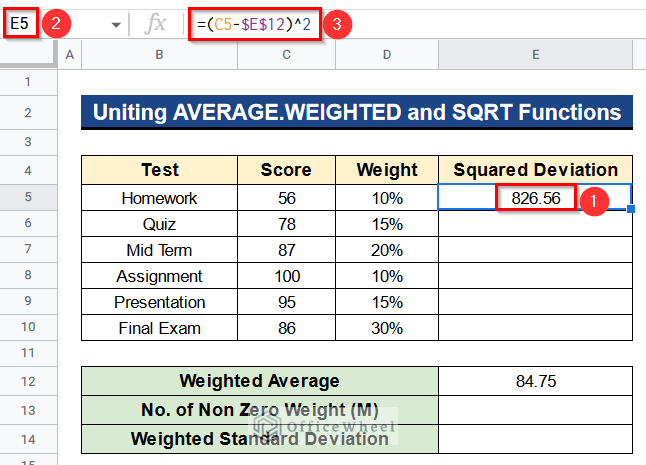
- Further, put the following formula in Cell E5–
=(C5-$E$12)^2- As well as, click the Enter button to get the squared deviation of the values.
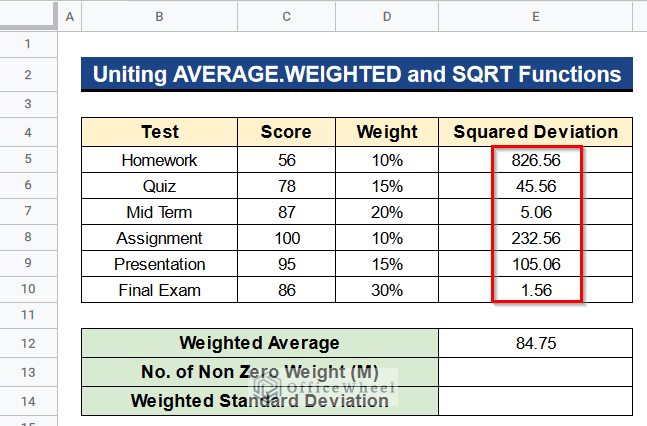
- In addition, use the Fill Handle tool to apply the formula for the rest of the cells in Column E.
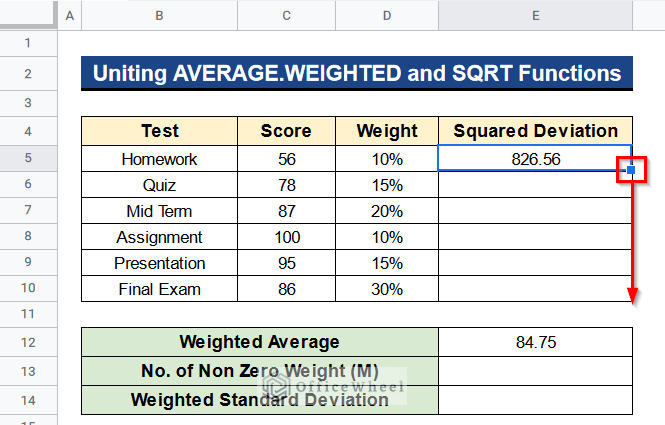
- Subsequently, you’ll find the squared deviation in all the cells of Column E.
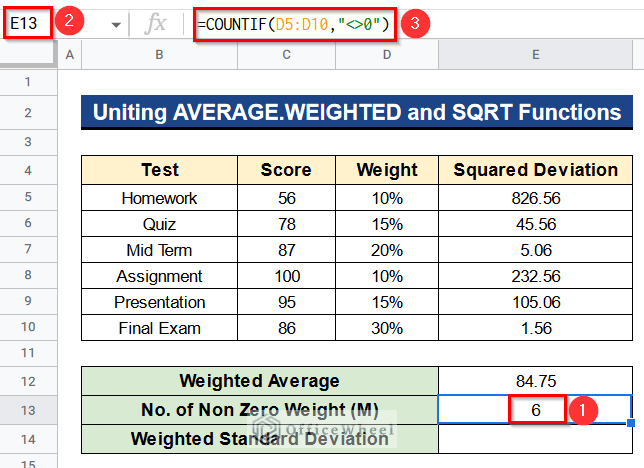
- Then, type the following formula in Cell E13–
=COUNTIF(D5:D10,"<>0")- Next, hit Enter to get the total numbers of non-zero weight (M) present in our dataset.
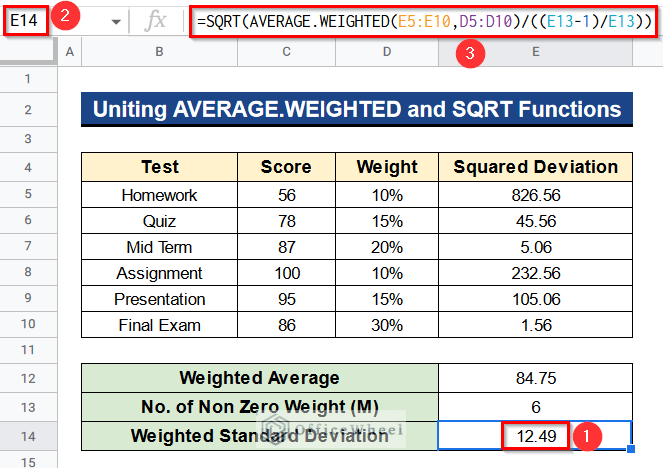
- After that, write the following formula in Cell E14–
=SQRT(AVERAGE.WEIGHTED(E5:E10,D5:D10)/((E13-1)/E13))- Ultimately, press Enter to get the standard deviation of weighted variables.
Formula Breakdown
- AVERAGE.WEIGHTED(E5:E10,D5:D10)
Earlier on, this function returns the weighted average of the Cells from E5 to E10 and D5 to D10.
- (E13-1)/E13
Then, we subtract 1 from Cell E13 and again divide the output by Cell E13.
- SQRT(AVERAGE.WEIGHTED(E5:E10,D5:D10)/((E13-1)/E13))
Finally, this formula returns the desired standard deviation of weighted variables.
Read More: How to Add Different Standard Deviation Bars in Google Sheets
Things to Remember
- You can put the weights both as percentages or in decimal form. For this, the result would be the same.
- Don’t forget to lock the Cell E12 which has the weighted average to calculate the squared deviation in Column E.
Conclusion
That’s all for now. Thank you for reading this article. In this article, I have discussed 2 suitable methods to calculate the standard deviation of weighted variables in Google Sheets. Please comment in the comment section if you have any queries about this article. You will also find different articles related to google sheets on our officewheel.com. Visit the site and explore more.