In Google Sheets, you may need help after inserting and editing a vast range of data when it comes to printing out the dataset. The main difficulty is that ...
Google Sheets will not only help you to analyze a huge range of data but also provide the easiest way to the visual representation of data through charts and ...
In Google Sheets to handle a large amount of data, freezing rows and columns is a very useful feature. By freezing important rows and columns you can easily ...
In Google Sheets, if you want to calculate a series of averages for a dataset in a fixed period, you can use the Moving Average method. The moving average is ...
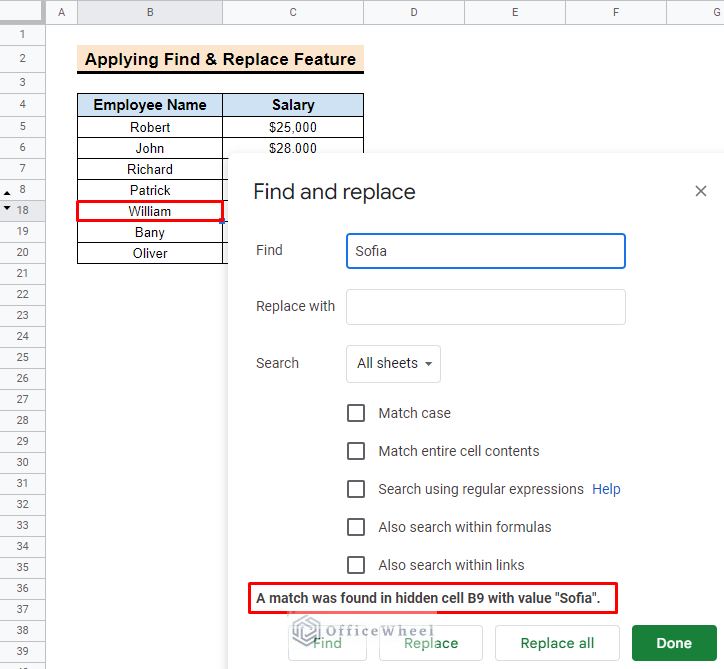
In Google Sheets, the hidden row feature is very useful when you have a huge dataset and you have to deal with a few of them. But after hiding data sometimes ...
In Google Sheets, sometimes we want to find unique values from a huge dataset. But unfortunately, if the dataset contains any blank cell, this also adds to the ...
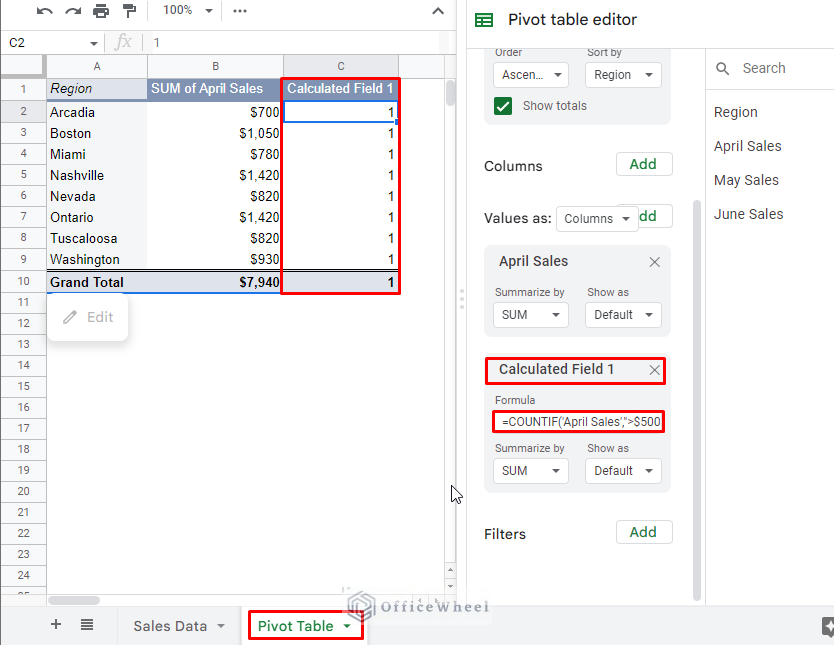
In Google Sheets, the Pivot Table can be a very useful tool to summarize a huge dataset. To analyze data, you can insert any general function from the Pivot ...
In Google Sheets, if you want to count values except for any specific values, you can also apply the COUNTIF function with a specialized operator. The ...
In Google Sheets, you can combine cells by using some functions. CONCATENATE, JOIN and TEXTJOIN are the most popular among them. To apply some conditions with ...
In Google sheets, you can present your data with great visual formatting by inserting charts. You can add and change the chart format in the easiest and ...
Calculating time duration is very necessary for the business and corporate sections. In Google Sheets, you can easily track your time by applying different ...
In Google Sheets, you can subtract thousands of data at a time by applying functions and formulas. Though there is no specific function for Subtraction, you ...
Sometimes you need to show standard deviation to analyze your data. In Google Sheets, it is quite easier to insert standard deviation in the graph. In this ...
In Google Sheets, calculating the average is the most common and basic function. We use this equation most often for different purposes. So, in this article, ...
During data analysis, data repetition is a significant problem. To get rid of this problem, you must create a unique dataset free from any type of redundant ...


