Learn how to easily calculate percentage change in Google Sheets. Use this powerful tool to track the performance of your data and make informed decisions. Whether you are a business owner, student, or professional, you can use this method to quickly analyze data in various fields such as finance, statistics, and marketing. Discover the importance of percentage change and how it can benefit you in the real world.
A Sample of Practice Spreadsheet
You can copy our spreadsheet that we’ve used to prepare this article.
4 Ways to Calculate Percentage Change in Google Sheets
Unlock the potential of data analysis with four methods for calculating percentage change in Google Sheets. Boost your analysis skills and make informed decisions.
1. Using Simple Division
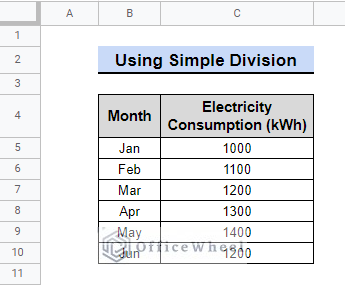
Assume we have a dataset showing how much electricity we consume each month. On a monthly basis, we’re going to track the change in consumption in the percentage. We will use the most basic and simple arithmetical approach to calculate percentage change in Google Sheets.
Steps:
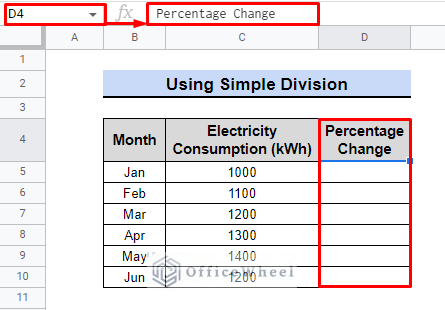
- First, Create a column next to the “Electricity Consumption (kWh)” column labeled “Percentage Change“.
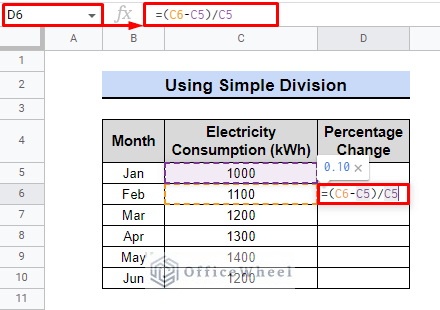
- Secondly, we will select the following cell D6 to measure the change.
- Thirdly, we’ll calculate the change using the following formula.
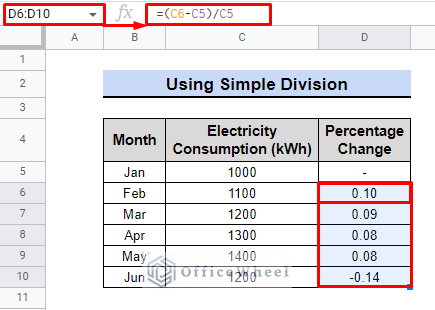
=(C6-C5)/C5- Later, we will find the change for the remaining cells by using the fill handler feature.
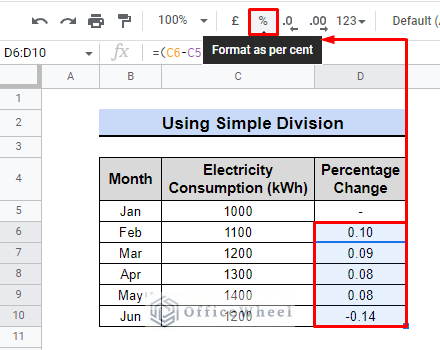
- Finally, we will use the format as per cent option to obtain the result in percentage.
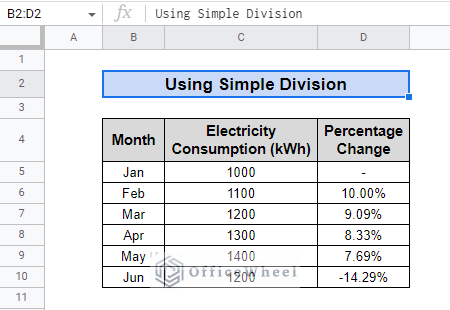
We can see that in the shift in consumption, the pace of growth was declining. The usage of electricity was, however, lower in the month of June than it was the month before. As a result, the percentage changes negatively or lessens.
Read More: How to Make a Percentage Chart in Google Sheets (3 Ways)
2. Applying TO_PERCENT Function
The TO_PERCENT function in Google Sheets formats a number as a percentage by attaching a percent sign and rounding it to a specified decimal.
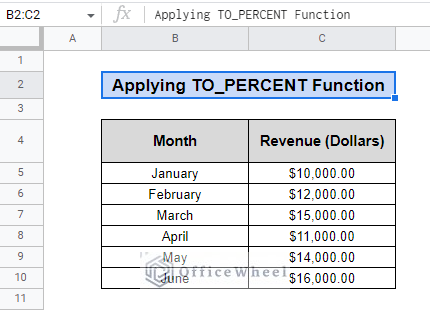
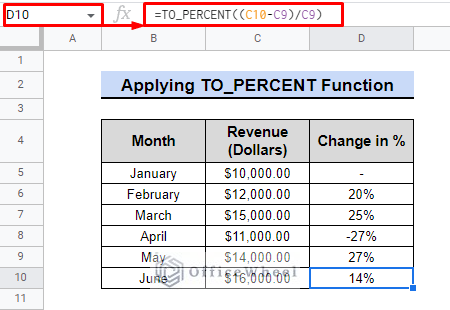
Suppose you have a dataset that tracks the sales of a store for the past 6 months. The dataset includes a column for the total sales revenue (in dollars). We want to add a column that shows the percentage change in revenue from month to month.
Steps:
- In column D, we will write the heading “Change in %”.
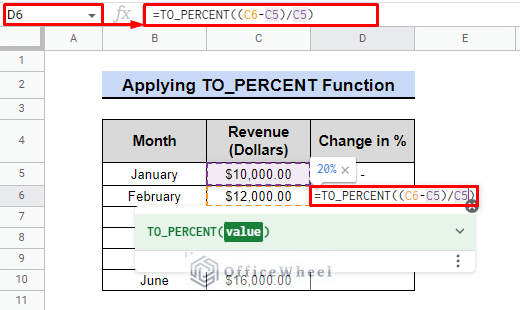
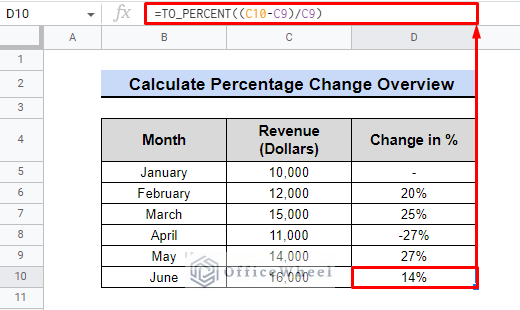
- Then, in cell D6, we will enter the formula to calculate the percentage change in revenue using TO_PERCENT function.
=TO_PERCENT((C6-C5)/C5)Formula Breakdown:
- Subtract the value in C5 from C6.
- Divide the result by C5.
- Use the TO_PERCENT function on the result to convert it to a percentage value.
- We are going to use the above-mentioned formula for the rest of the dataset.
We can see the fluctuation in the months of April and May. In April, the revenue dropped by 27% compared to March, and in May, it increased by 27% compared to April.
Read More: How to Use TO_PERCENT Function in Google Sheets
3. Using Simple Formula (Percentage Increasing or Decreasing)
Calculating percentage change, whether it’s an increase or decrease, is an important skill in various fields such as business and finance. Learn how to do it easily with Google Sheets.
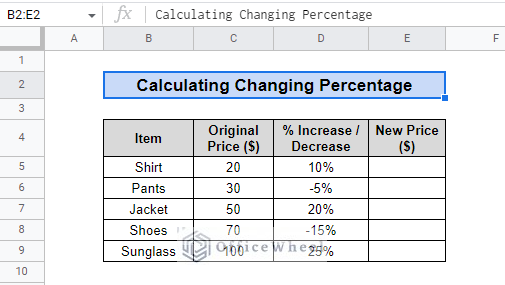
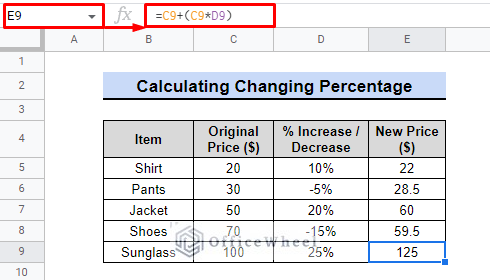
Assume that we have a data set that includes items and their original price in dollars. We need to find the new price after a change in percentage.
Steps:
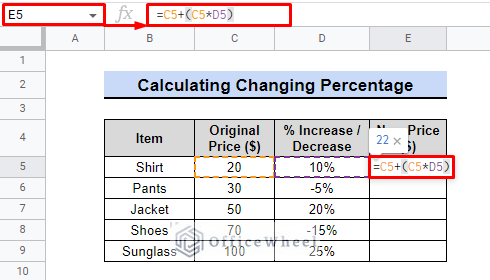
- Initially, we will choose cell E5.
- Now, in order to determine the new price, we’ll utilize the formula below.
=C5+(C5*D5)- For all the other cells, we will use the same equation:
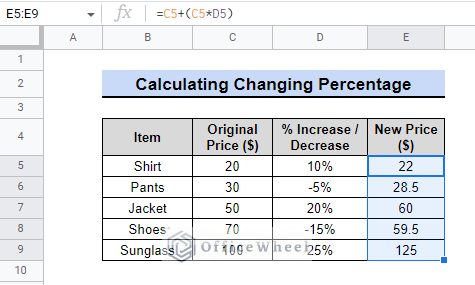
=Original Price + (Original Price x Percentage Change)Therefore, by adding a percentage increase or decrease to the original price, we can quickly determine new prices using the method below. For instance, if a shirt was previously $20 and we wanted to increase the price by 10%, the new cost would be $22.
Read More: Calculate Percentage Increase in Google Sheets (4 Ways)
4. Utilizing ARRAYFORMULA Function (Percentage Change in a Column)
In a small dataset, changing the percentage is simple. However, if we have a lot of data, we may calculate the percentage change in Google Sheets by using the ARRAYFORMULA function.
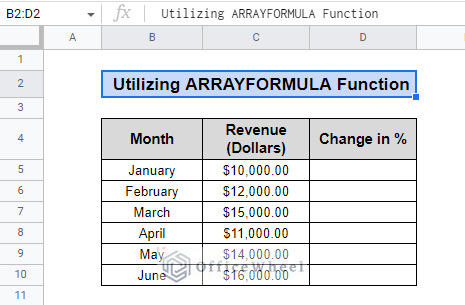
Assume we have the same dataset that tracks the sales of a store for the past 6 months. We are going to use this dataset to demonstrate the formula.
Steps:
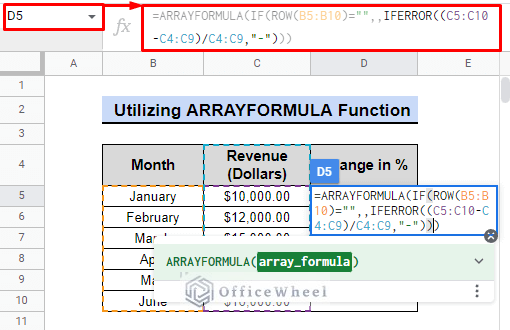
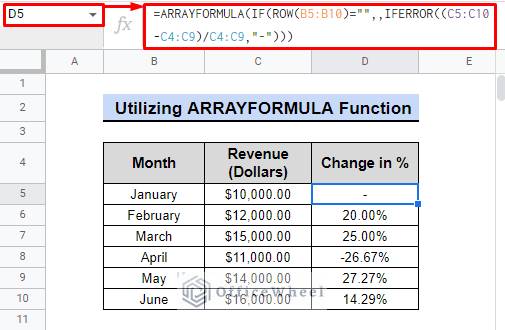
- Once again, we are going to select cell D5 first.
- Later on, we will use the following formula for the entire dataset.
=ARRAYFORMULA(IF(ROW(B5:B10)="",,IFERROR((C5:C10-C4:C9)/C4:C9)))Formula Breakdown:
- The ARRAYFORMULA function applies the nested IF function to a range of cells with the following logic.
- By using the IF function it checks whether the current row of range B5:B10 is empty or not. If empty, returns nothing, If not empty, it proceeds with the next step.
- Using the IFERROR function to check for errors in the formula (C5:C10-C4:C9)/C4:C9. If an error is found, returns “-”. If no error is found, return the calculated result.
- Because of the use of the ARRAYFORMULA, the column or cell ranges automatically fill with the necessary data, eliminating the need for manual fill handling.
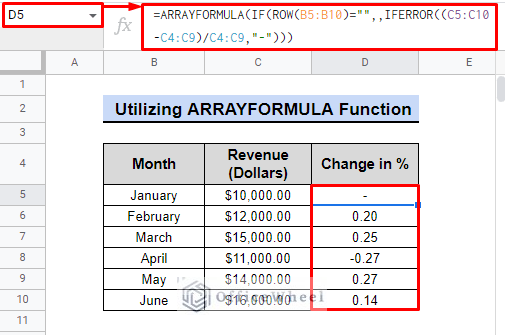
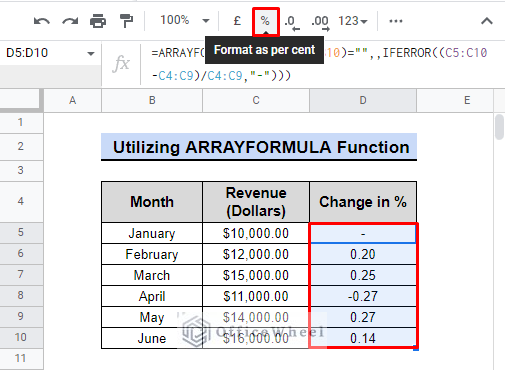
- Now, we’ll use the format as per cent option once more to display the outcome as a percentage.
As a result, the formula will return “-“ for the month of January because there is no prior data to compare it to. The remaining months will allow us to evaluate the change.
Read More: How to Calculate Percentage in Google Sheets (4 Ideal Examples)
Conclusion
The ability to calculate percentage change is crucial in daily life, as it enables individuals and businesses to monitor changes in metrics such as sales, investments, and expenses. This article provides multiple methods for calculating percentage change in Google Sheets, allowing you to choose the best approach for your needs. For additional information and tips, visit OfficeWheel.

