“A picture is worth a thousand words”. Charts, Graphs, or Diagrams are important for better presentation, and for a better understanding of a specific topic. ...
We often need to know about just some specific range of data from a sea of data. Like, a company has data of all the information of several years but what an ...
We often need to get the result of a particular task in the fastest possible way. Like, if an employee of a company has a dataset containing records of all the ...
We often need to know the specific amount of a particular type of number within a range. Like most schools publish their results not showing the marks but ...
Companies always calculate the profit and loss on the sale of their products as a percentage and supply the products to the market accordingly. It also helps ...
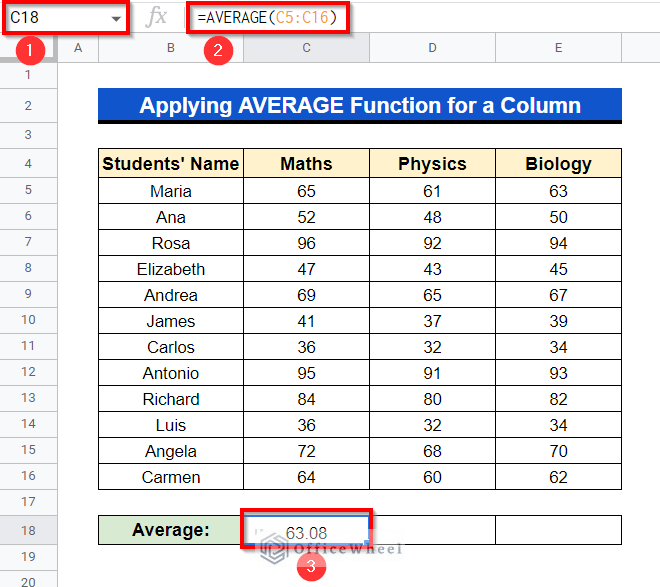
One technique to examine a group of numbers and identify the core value is to calculate the AVERAGE. When a teacher takes a test on a group of students, for ...
Sometimes we input wrong or improper data subconsciously, knowingly or by any kind, and eventually it comes up to correct them all. Obviously, we have no time ...
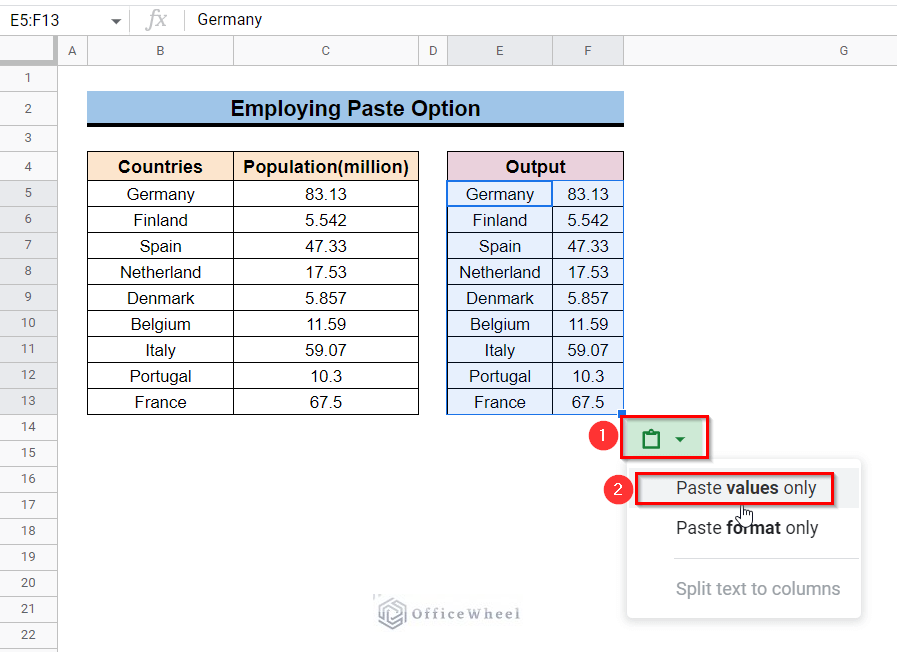
Sometimes we need just the output rather than the input. Google sheets and Excel are the most used software for any company, industry, or any sector because ...


