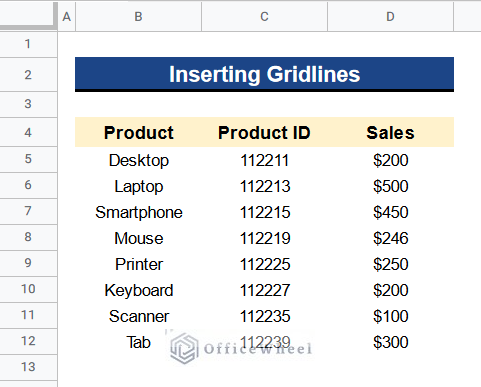
It’s often necessary to be able to customize the look of your Google Sheets in order to make the data simpler to read. Data can be made much easier to read by adding gridlines and borders around your dataset in Google Sheets. You have the option to add borders to your entire sheet or just a particular set of cells. In Google Sheets, gridlines are always present by default. However, occasionally there won’t be a gridline in your dataset. So, in this article, we’ll see 4 suitable methods on how to insert gridlines in Google Sheets with clear images and steps. We’ll also see how to bold gridlines in Google Sheets. At last, you’ll get an output like the following image.
A Sample of Practice Spreadsheet
You can download Google Sheets from here and practice very quickly.
4 Suitable Methods to Insert Gridlines in Google Sheets
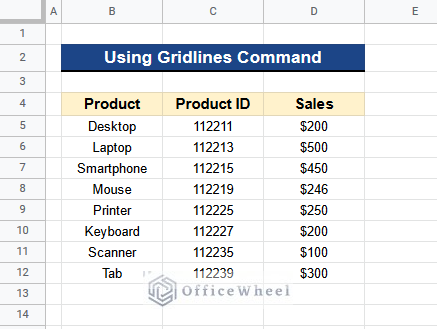
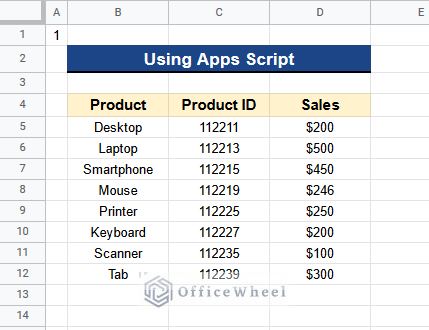
Let’s get introduced to our dataset first. Here we have some products in Column B, product ids in Column C, and their sales prices in Column D. As you can see there are no gridlines around our dataset by default. Now we want to insert gridlines here. So, I’ll show you 4 suitable methods on how to insert gridlines in Google Sheets by using this dataset.
1. Using Gridlines Command
The first method is quite simple. There is a Gridlines command under the View menu in Google Sheets. If we select this command then we can see the gridlines in our Google Sheets. When we deselect this Gridlines command the gridlines automatically disappear.
Steps:
- Firstly, go to View > Show > Gridlines.
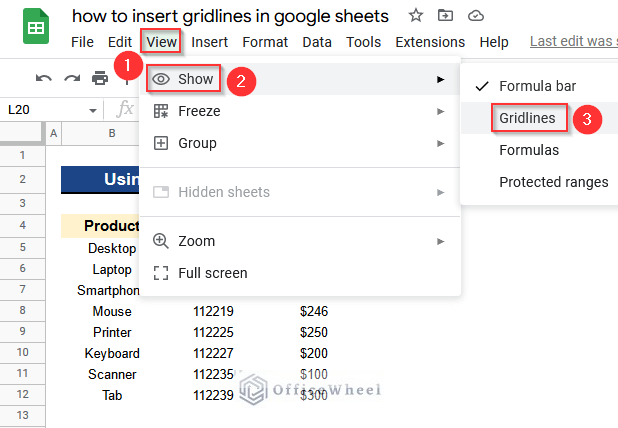
- Then, you’ll see the gridlines in your Google Sheets.
2. Applying Borders Tool
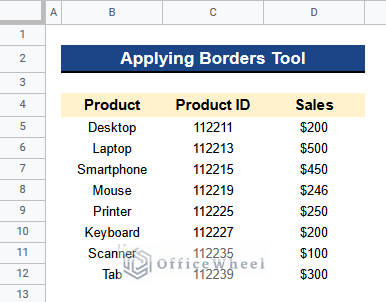
Now, we want to insert gridlines partially in the sheet, which means only for the dataset, and that is not possible by the Gridline command. So alternatively, we can use the Borders command here. we have the following dataset where we want to put some borders to make it look nice and tidy. We can do this by applying the Borders tool in Google Sheets. This tool is located in the Toolbar at the top of the Formula Bar. you’ll find it there easily and can use it frequently. Let’s see the steps.
Steps:
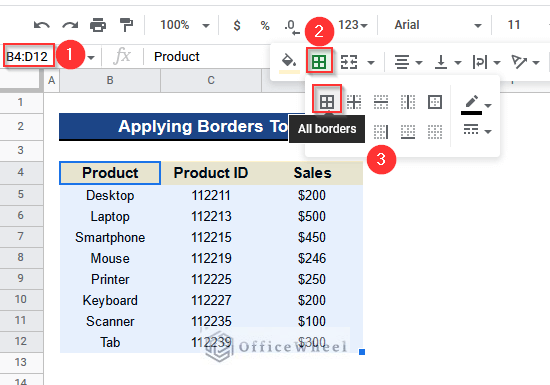
- At first, select all the cells from Cell B4 to D12.
- Then, click on the Borders icon from the Toolbar of your Google Sheets.
- Next, select the All Borders icon under the Borders menu.
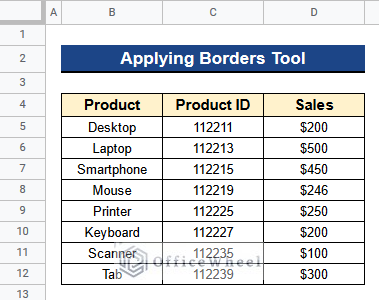
- Finally, you’ll see borders around your dataset.
Read More: How to Insert Formula in Google Sheets for Entire Column
Similar Readings
- How to Insert a Textbox in Google Sheets (An Easy Guide)
- Insert Page Break in Google Sheets (An Easy Guide)
- How to Have More than 26 Columns in Google Sheets
- Insert Rows Between Other Rows in Google Sheets (4 Easy Ways)
- How to Insert Multiple Rows in Google Sheets (4 Ways)
3. Inserting Gridlines When Printing
Sometimes we need to insert gridlines when we print our Google Sheets. The gridlines should be present by default when we print our dataset. But if the gridlines aren’t there then we have to follow the below steps.
Steps:
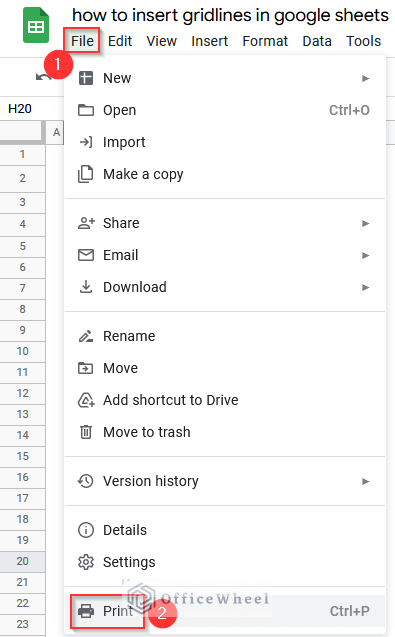
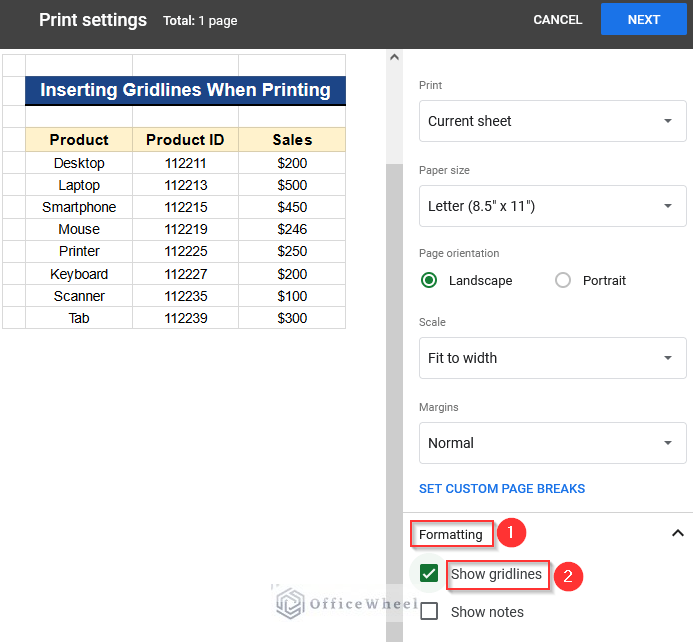
- First, go to File > Print or press the Ctrl+P shortcut to open the Print window.
- Then, you’ll see no grid around your dataset in the print area.
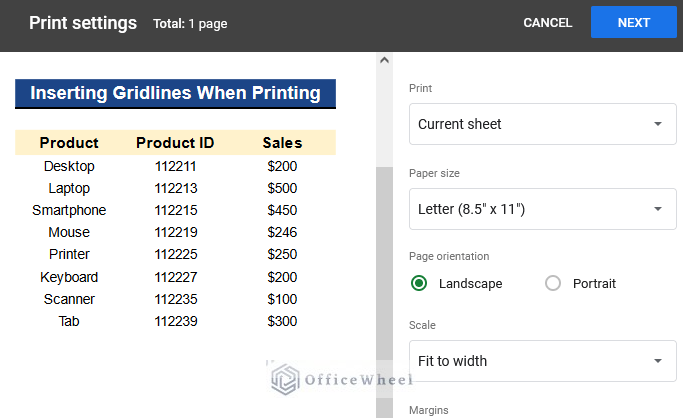
- So, select Show Gridlines under the Formatting menu to insert the gridlines.
- In the end, you’ll see gridlines around the dataset in the print area.
4. Using Apps Script
Apart from the previous methods, we can also use the Apps Script Extensions to insert gridlines in Google Sheets automatically. We have to just insert some script code in the Apps Script window and it will work smoothly. You’ll find the process below.
Steps:
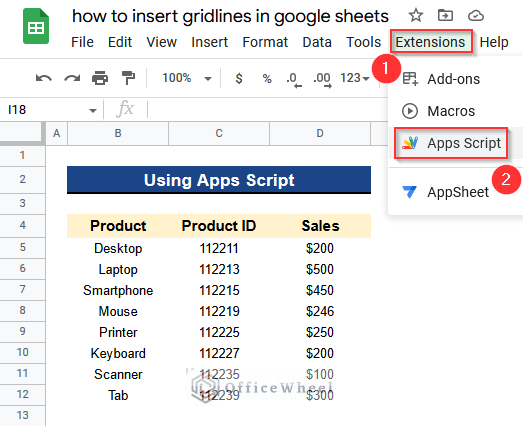
- In the beginning, select Apps Script under the Extensions menu to open the Apps Script window.
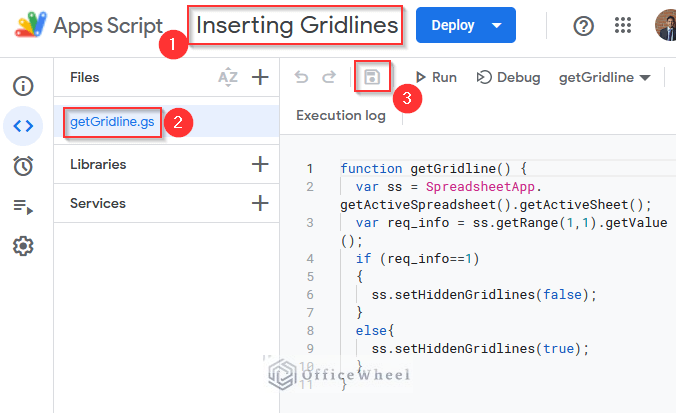
- Then, rename the entire script as “Inserting Gridlines” and the file as “getGridline”.
- Next, insert the following code in the code box-
function getGridline() {
var ss = SpreadsheetApp.getActiveSpreadsheet().getActiveSheet();
var req_info = ss.getRange(1,1).getValue();
if (req_info==1)
{
ss.setHiddenGridlines(false);
}
else{
ss.setHiddenGridlines(true);
}
}
- After that, click on the Save button to save the script code.
Code Breakdown
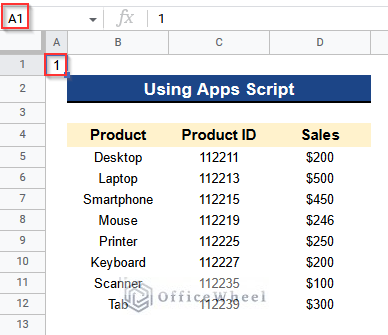
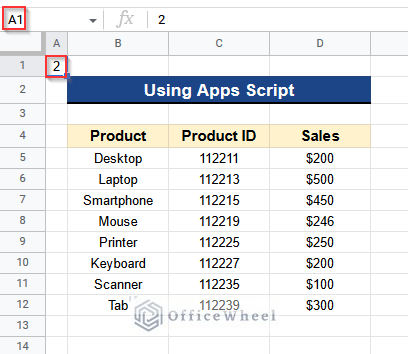
- This script code first search for values in Cell A1 of our dataset.
- Then, if the value is 1 it will bring the gridlines in the dataset.
- When the value is not 1, say 2 it vanishes the gridlines.
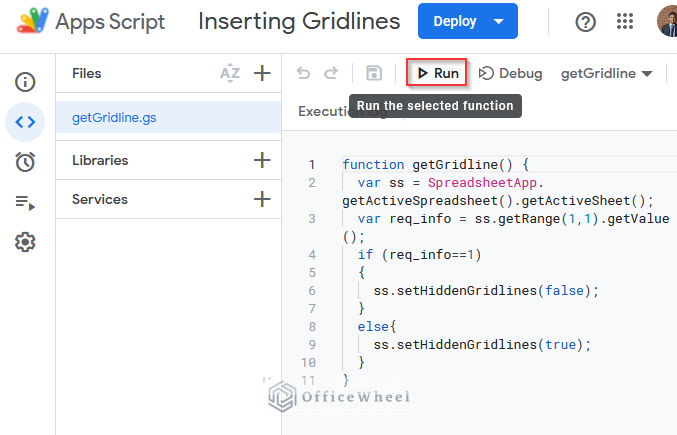
- Again open the Apps Script window and press the Run button to run the script code.

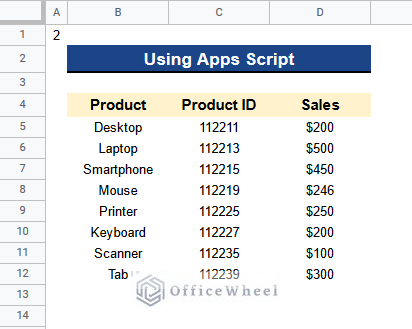
- You’ll notice that the gridlines are now automatically present all around your dataset.
- You can also turn off the gridlines as before.
- For that purpose, again write 2 in Cell A1 of your dataset.
- Then, run the script code by pressing the Run button in the Apps Script window.
- Now, you can see that the gridlines vanished automatically.
How to Bold Gridlines in Google Sheets
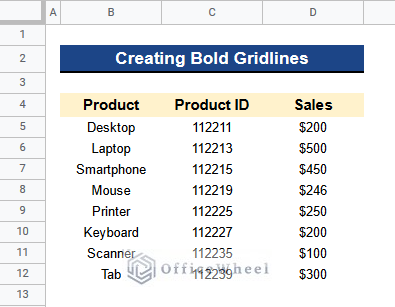
At this moment, we have the following dataset and we want gridlines around these values of our dataset. And we also want to make the gridlines bold. But there is no default way to make the gridlines bold, so again we’ll need the help of the Borders command. Because we can change the border color and thickness. Below you’ll see the process to bold gridlines in Google Sheets.
Steps:
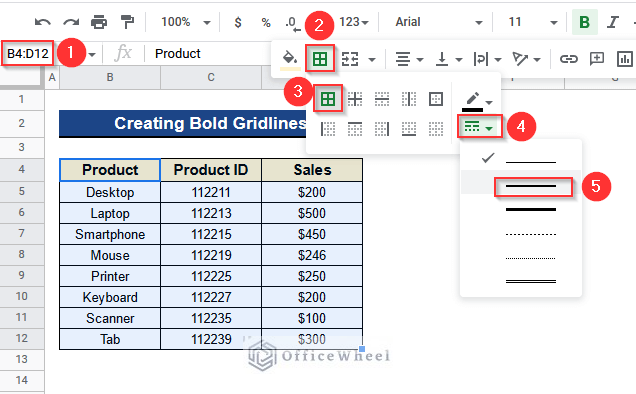
- Before all, activate all the cells from Cell B4 to D12 where we want to put gridlines.
- Then, click on the Borders icon in the Toolbar of your Google Sheets.
- Next, select the All Boarders icon and choose the Second Gridline as shown in the picture under the Borders Style menu.
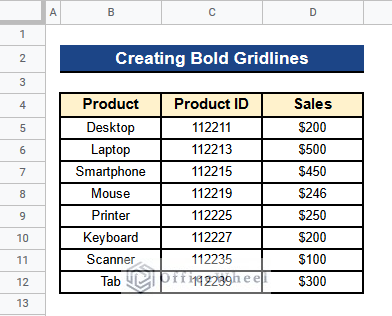
- Ultimately, you’ll find the bold gridlines around your dataset in Google Sheets.
Conclusion
That’s all for now. Thank you for reading this article. In this article, I have discussed 4 suitable methods on how to insert gridlines in Google Sheets. I have also discussed how to bold gridlines in Google Sheets. Please comment in the comment section if you have any queries about this article. You will also find different articles related to google sheets on our officewheel.com. Visit the site and explore more.
Related Articles
- How to Insert Superscript in Google Sheets (2 Simple Ways)
- Insert Button in Google Sheets (5 Quick Steps)
- How to Add Parentheses in Google Sheets (5 Ideal Scenarios)
- Insert Sparklines in Google Sheets (4 Useful Examples)
- How to Insert Multiple Columns in Google Sheets (2 Quick Ways)
- Paste and Insert Rows in Google Sheets (3 Easy Ways)
- How to Insert a Header in Google Sheets (2 Simple Scenarios)