You might be familiar with the idea of a slope and trendline if you frequently show research reports, or financial data, or need to perform mathematical puzzles. The term “slope” refers to calculating the steepness and direction of a line. A rising line will have a positive slope (lower to the left and higher to the right). A line with a negative slope is one that slopes downward (higher to the left and lower to the right). In this article, I’ll demonstrate 4 simple ways to find the slope of a trendline in Google Sheets. Here is an overview of what we will achieve:
4 Simple Ways to Find Slope of Trendline in Google Sheets
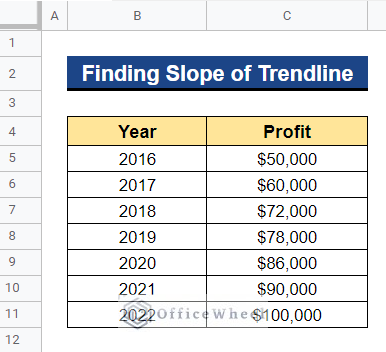
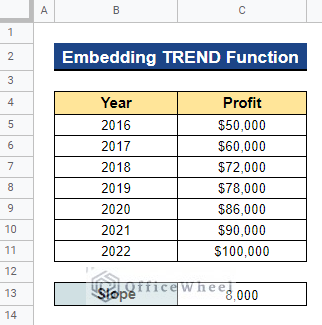
We will use the dataset below to demonstrate 4 simple ways to find the slope of a trendline in Google Sheets. The dataset contains a list of years and a company’s profit for each year. We now need to construct a trendline for this dataset, sometimes referred to as a line of best fit or a regression line, which visually depicts patterns in data series. Next, we’ll calculate the slope of the trendline for our dataset.
1. Using Chart Feature
We can use a chart to find the slope of a trendline in Google Sheets. For this, you have to create a chart first. And Google Sheets make it very easy and fast to create a chart. First, we will use the chart to get the trendline. Then, from the trendline, we will get the slope of the trendline.
Steps:
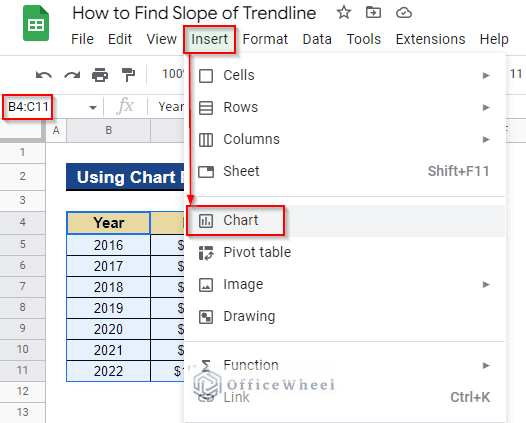
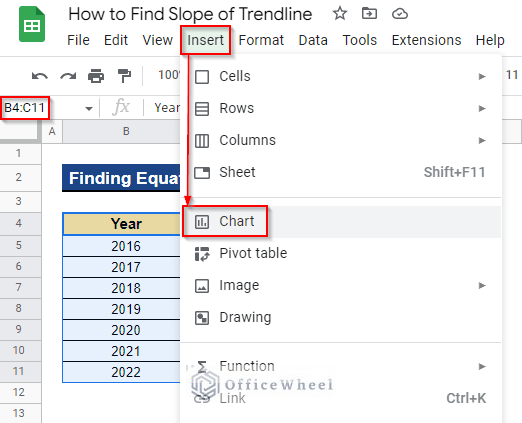
- First, select the entire dataset to create a chart. In our case, we selected Cell B4:C11. Next, go to the Insert tab from the top menu bar and select Chart.
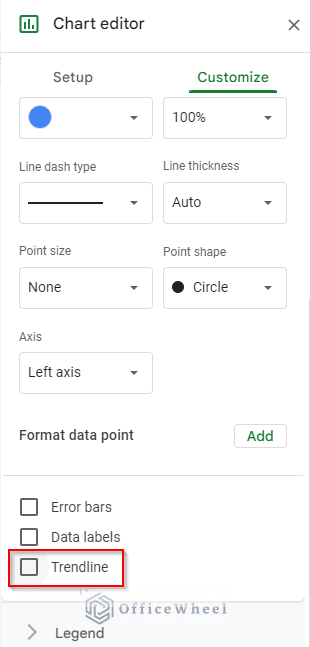
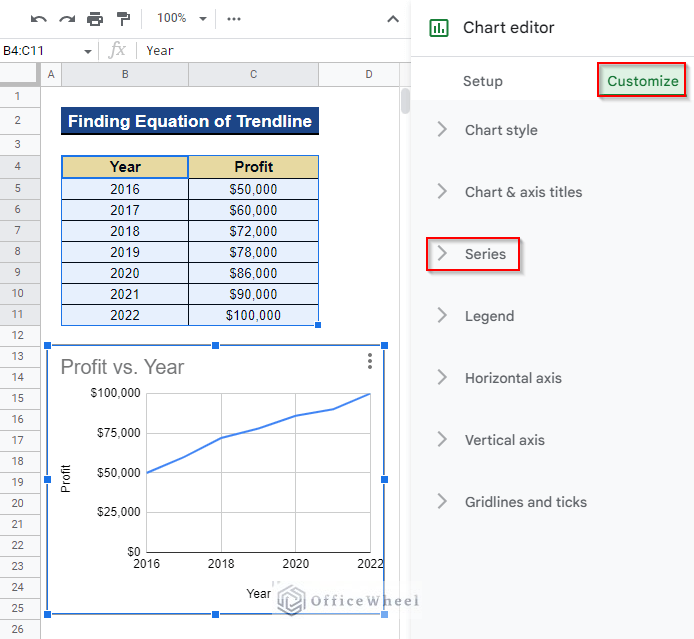
- As a result, a line chart will appear on your screen. Along with the chart, a dialog box named Chart editor will also pop up on your screen for editing the chart. Next, go to the Customize section and click on the Series field.
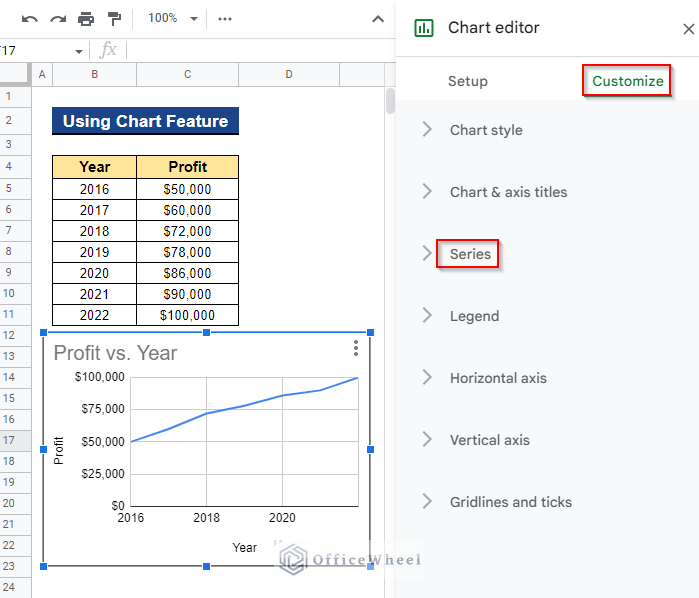
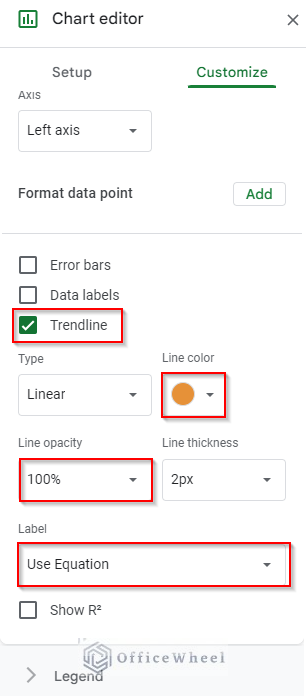
- After that, click on the Trendline section.
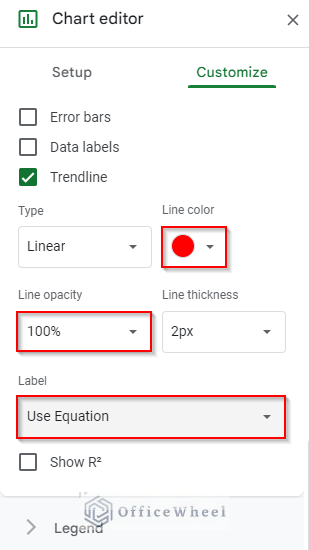
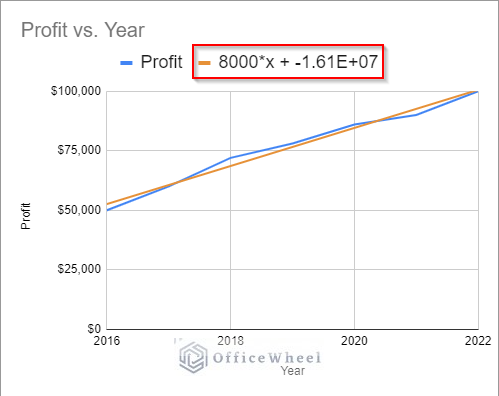
- It will create a trendline on your chart. You may choose color and opacity for your trendline. In our case, we choose red as the trendline color and choose line opacity 100%. Now, to get the trendline equation, select Use Equation from the Label section.
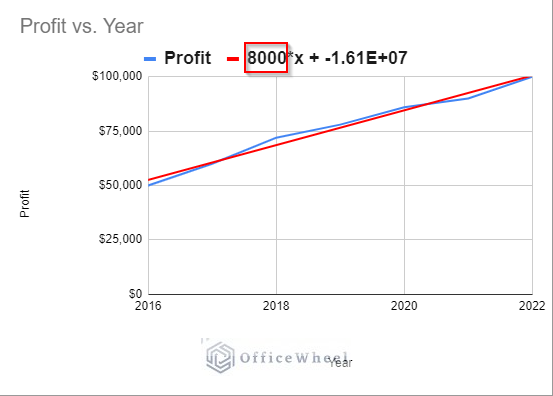
- Thus, you will get the trendline equation on top of your chart which is y=mx+c, where m is the slope of the trendline. Therefore, the slope of our trendline is 8000.
Read More: How to Find Slope of Graph in Google Sheets (With Easy Steps)
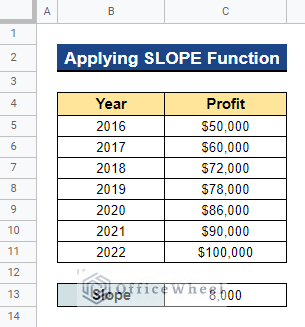
2. Applying SLOPE Function
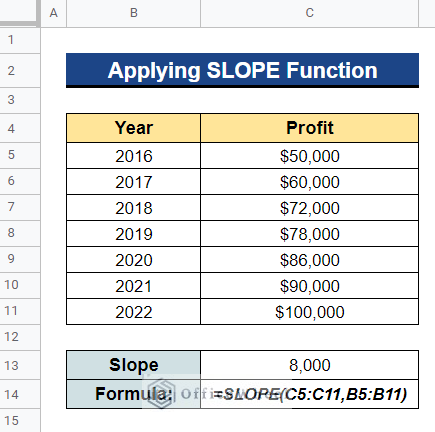
To get the slope of the trendline for our dataset, we may even utilize a function. The SLOPE function assists in determining the gradient of two separate provided arrays in Google Sheets. The advantage of this approach is that you can determine the slope’s value without having to draw a chart or trendline. It is one of the easiest and fastest ways to find the slope of the trendline.
Steps:
- First, select a cell where you want to apply the formula. In our case, we selected Cell C13. Next, type the formula below and press Enter–
=SLOPE(C5:C11,B5:B11)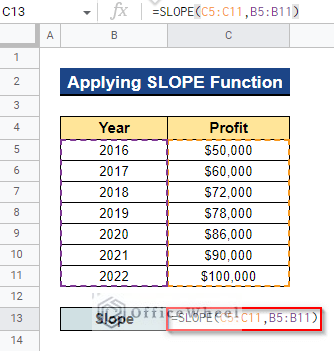
- As a result, you will get the slope of the trendline of your dataset.
Read More: How to Find P-Value in Google Sheets (With Quick Steps)
Similar Readings
- How to Find Correlation Coefficient in Google Sheets
- Find Linear Regression in Google Sheets (3 Methods)
- How to Find Largest Value in Column in Google Sheets (7 Ways)
- Find the Range in Google Sheets (with Quick Steps)
- How to Find Trash in Google Sheets (with Quick Steps)
3. Employing FORECAST Function
By utilizing the FORECAST function, you can also determine the trendline’s slope. The FORECAST function in Google Sheets applies linear regression to determine the linear connection between the value series and timeline series in order to predict future values.
Steps:
- Firstly, choose a cell where you’re going to apply the formula. In our case, we chose Cell C13. Next, enter the following formula and press Enter–
=FORECAST(1,C5:C11,B5:B11)-FORECAST(0,C5:C11,B5:B11)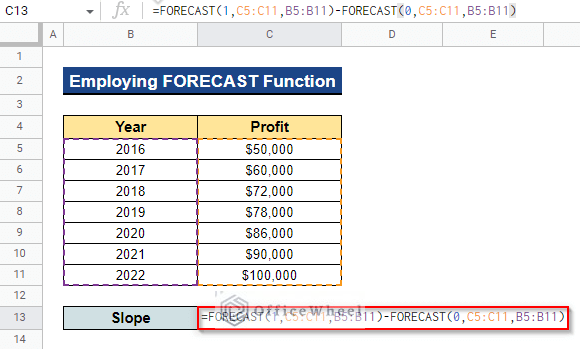
Formula Breakdown
- FORECAST(1,C5:C11,B5:B11)
Here, the FORECAST function returns the value of slope(m) and y-axis intersect(c).
- FORECAST(0,C5:C11,B5:B11)
Then, this returns the value of the y-axis intersect(c) only.
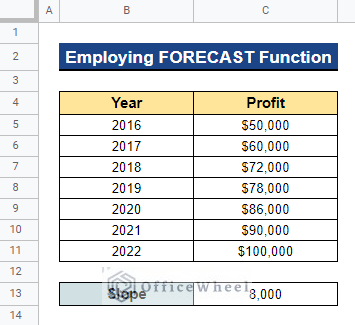
- FORECAST(1,C5:C11,B5:B11)-FORECAST(0,C5:C11,B5:B11)
Finally, it calculates (m+c)-c and returns the value of slope(m) only.
- Thus, you will get the trendline’s slope for your dataset.
Read More: Easy Guide to Replace Formula with Value in Google Sheets
4. Embedding TREND Function
The slope of a trendline can also be calculated using a different function called the TREND function. You may determine the data pattern in a collection of data points using Google Sheets’ TREND function. It also provides the predicted value of the dependent variable in the future, based on a predefined value for the independent variable.
Steps:
- First, pick a cell where you’ll apply the formula. In this instance, we chose Cell C13. After that, input the formula below and hit Enter–
=TREND(C5:C11,B5:B11,1,true)-TREND(C5:C11,B5:B11,0,true)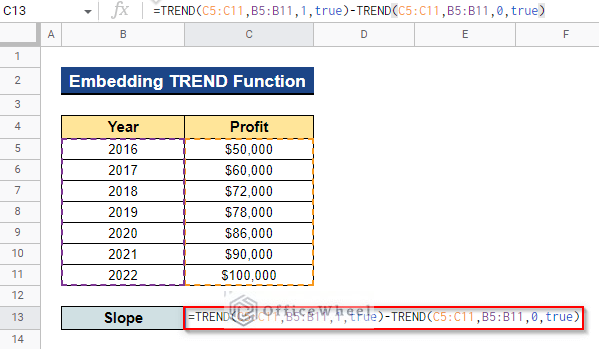
Formula Breakdown
- TREND(C5:C11,B5:B11,1,true)
Here, the TREND function returns the value of slope(m) and y-axis intersect(c).
- TREND(C5:C11,B5:B11,0,true)
Later, this returns the value of the y-axis intersect(c) of the trendline.
- TREND(C5:C11,B5:B11,1,true)-TREND(C5:C11,B5:B11,0,true)
Finally, it returns the value of slope(m) only by calculating (m+c)-c.
- As a result, you will obtain the trendline’s slope for your dataset.
Read More: How to Search in All Sheets in Google Sheets (An Easy Guide)
How to Find Equation of Trendline in Google Sheets
We may even wish to find the equation of the trendline in Google Sheets because it doesn’t get visible by default. Here, I’ll demonstrate how to accomplish this.
Steps:
- Firstly, you have to create a chart for your dataset. To do so, select the entire dataset. We selected Cell B4:C11.
- Next, go to the Insert tab from the top menubar and select Chart.
- A line chart will therefore show up on your screen. A dialog window titled Chart editor will also appear on your screen along with the chart to allow you to change it.
- Next, go to the Customize section and click on the Series field.
- Click on the Trendline section after that. Your chart will develop a trendline as a result.
- You may choose your trendline’s color and opacity. In this instance, we decide to use 100% line opacity and the color red for the trendline.
- Now choose Use Equation from the Label section to obtain the trendline equation.
- Thus, you’ll obtain the trendline’s equation on top of your chart.
Conclusion
That’s all from this article. Here, I’ve covered 4 simple ways to find the slope of a trendline in Google Sheets. I’ve also shown how to find the equation of a trendline in Google Sheets. I hope this will meet your requirements. Please feel free to any queries or suggestions in the comment section below. To explore more, visit our site Officewheel.com.
Related Articles
- How to Use the Find Function in Google Sheets (An Easy Guide)
- Find All Cells With Value in Google Sheets (An Easy Guide)
- How to Find and Delete in Google Sheets (An Easy Guide)
- Use FIND Function in Google Sheets (5 Useful Examples)
- How to Find Median in Google Sheets (2 Easy Ways)
- Find and Replace in Google Sheets (3 Ways)
- How to Find Hidden Rows in Google Sheets (2 Simple Ways)